Overview
Transportation services like Uber and Lyft require streaming data with real-time processing for actionable insights on a minute-by-minute basis. While batch data can provide powerful insight on medium or long-term trends, in this age live data analytics is an essential component
of enterprise decision making. It is said data loses its importance within 30 minutes of generation. To facilitate better performance for companies that hugely depend on live data, Striim offers continuous data ingestion from multiple data sources in real-time. With Striim’s powerful log-based Change Data
Capture platform, database transactions can be captured and processed in real-time along with data migration to multiple clouds. This technology can be used by all e-commerce, food-delivery platforms, transportation services, and many others that harnesses real-time analytics to generate value. In this
blog, I have shown how real-time cab booking data can be streamed to Striim’s platform and processed in-flight for real-time visualization through Striim’s dashboard and simultaneous data migration to BigQuery at the same time.
Video Walkthrough
Core Striim Components
File Reader: Reads files from disk using a compatible parser.
Stream: A stream passes one component’s output to one or more other components. For example, a simple flow that only writes to a file might have this sequence
Continuous Query : Striim Continuous queries are are continually running SQL queries that act on real-time data and may be used to filter, aggregate, join, enrich, and transform events.
Window: A window bounds real-time data by time, event count or both. A window is required for an application to aggregate or perform calculations on data, populate the dashboard, or send alerts when conditions deviate from normal parameters.
WAction and WActionStore: A WActionStore stores event data from one or more sources based on criteria defined in one or more queries. These events may be related using common key fields.
BigQueryWriter: Striim’s BigQueryWriter writes the data from various supported sources into Google’s BigQuery data warehouse to support real time data warehousing and reporting.
Dashboard: A Striim dashboard gives you a visual representation of data read and written by a Striim application
Using Striim for CDC
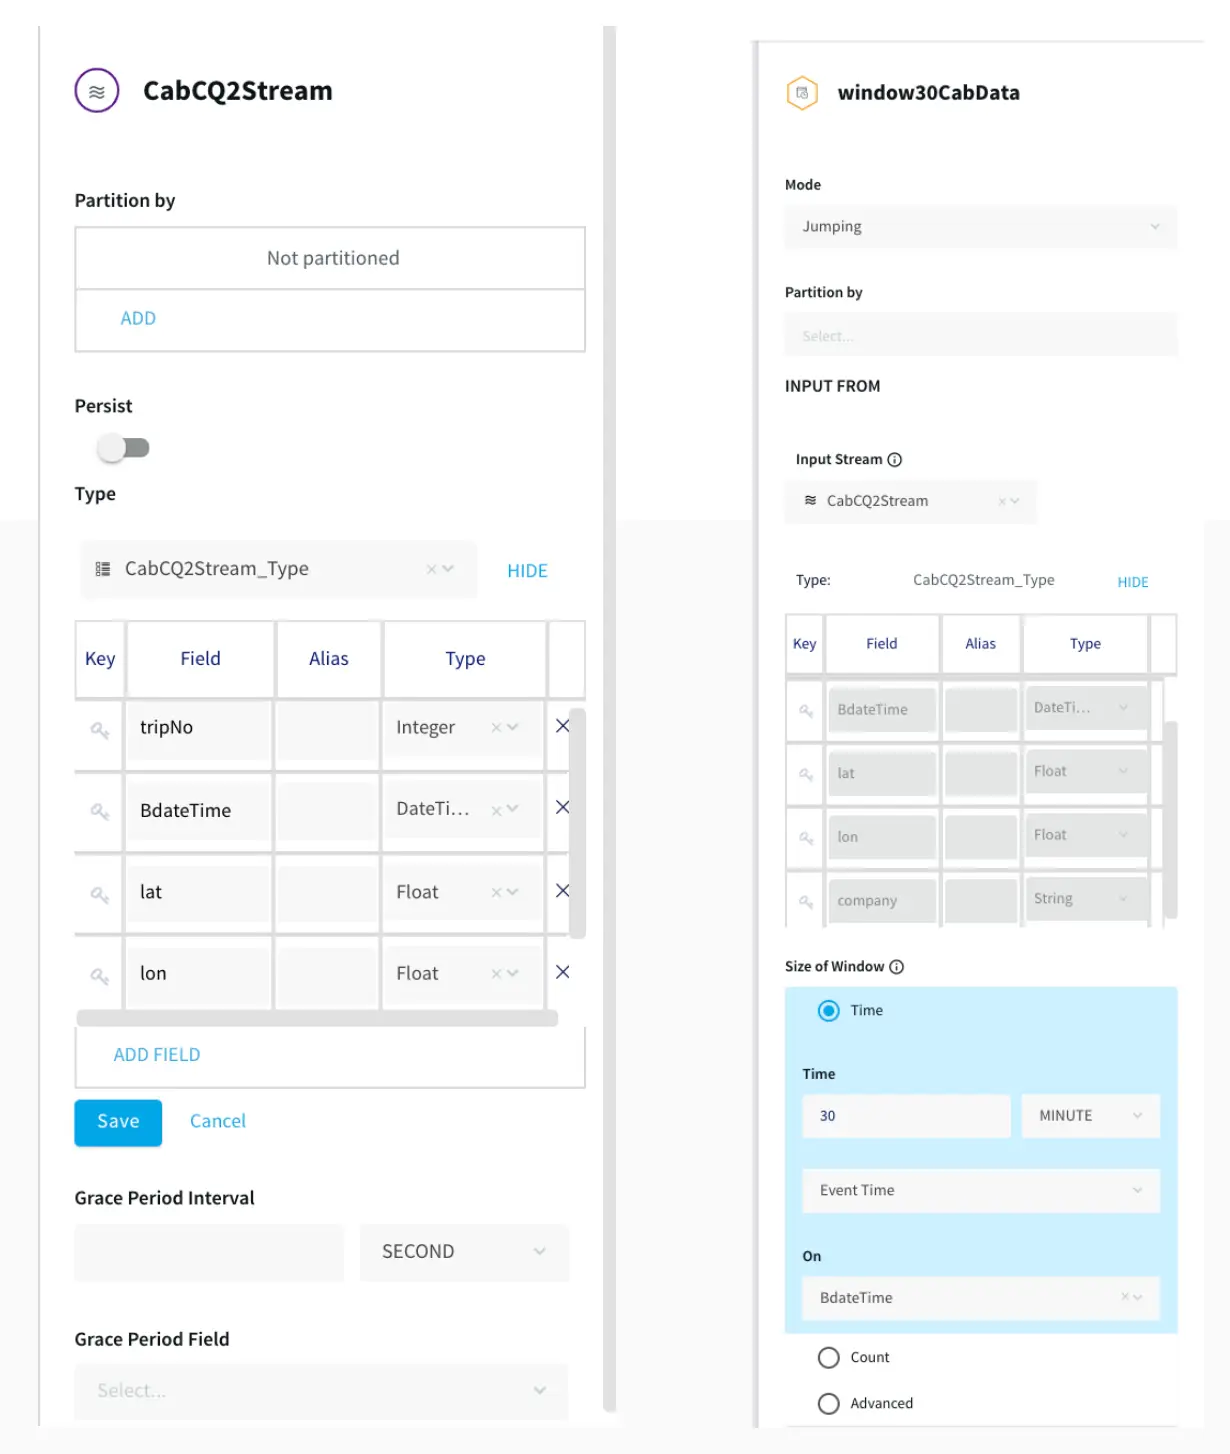
Change Data Capture has gained popularity in the last decade as companies have realized the power of real-time data analysis from OLTP databases. In this example, data is acquired from a CSV file and streamed with a window of 30 minutes. Due to memory limitation, the window was
kept for 30 minutes for better visualization. Ideally, Striim can handle a window of even 1 second when the amount of data is huge. The data was also processed inside Striim and the change was captured and migrated to BigQuery data warehouse.
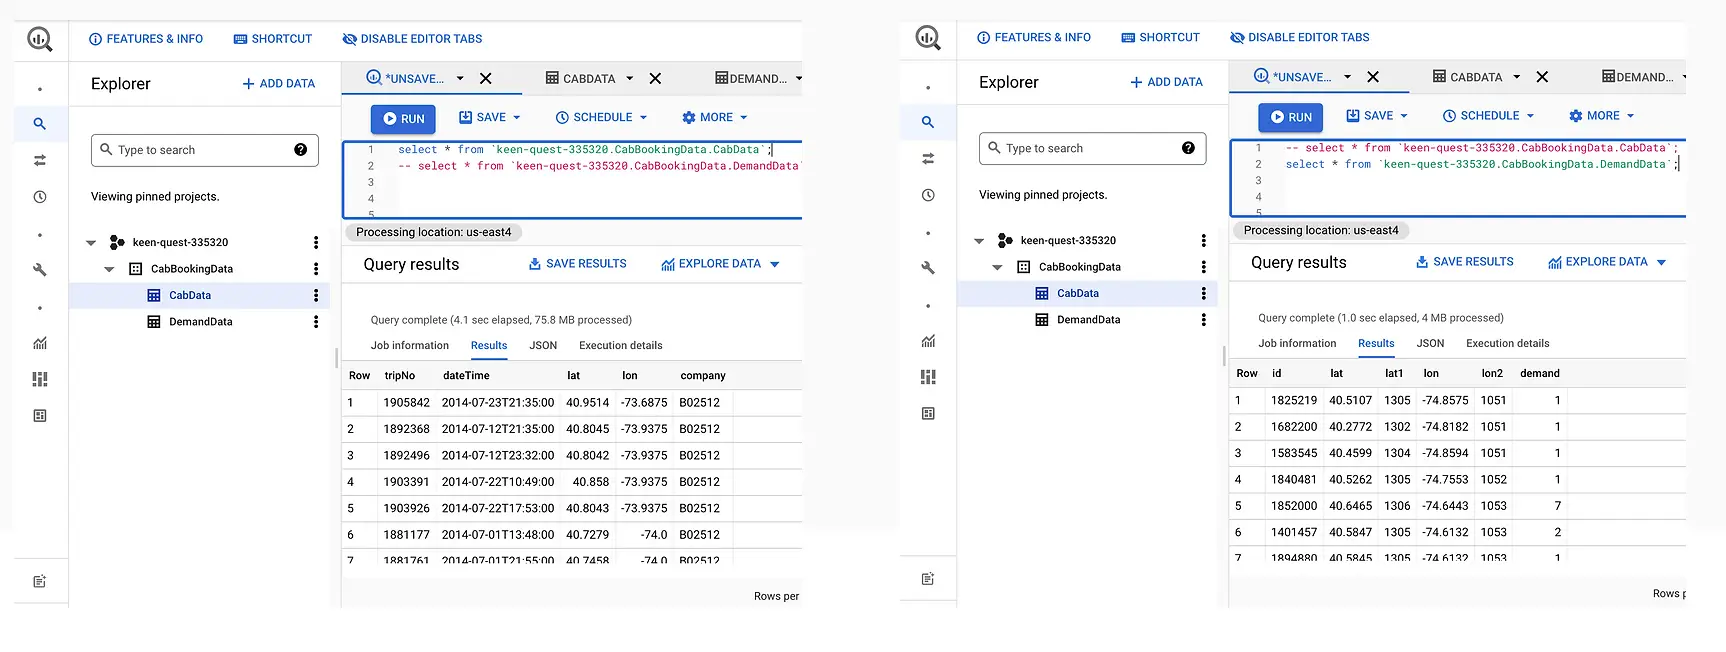
The dataset used in this example contains 4.5 million uber booking data that contains 5 features, DateTime, latitude, longitude, and TLC base company
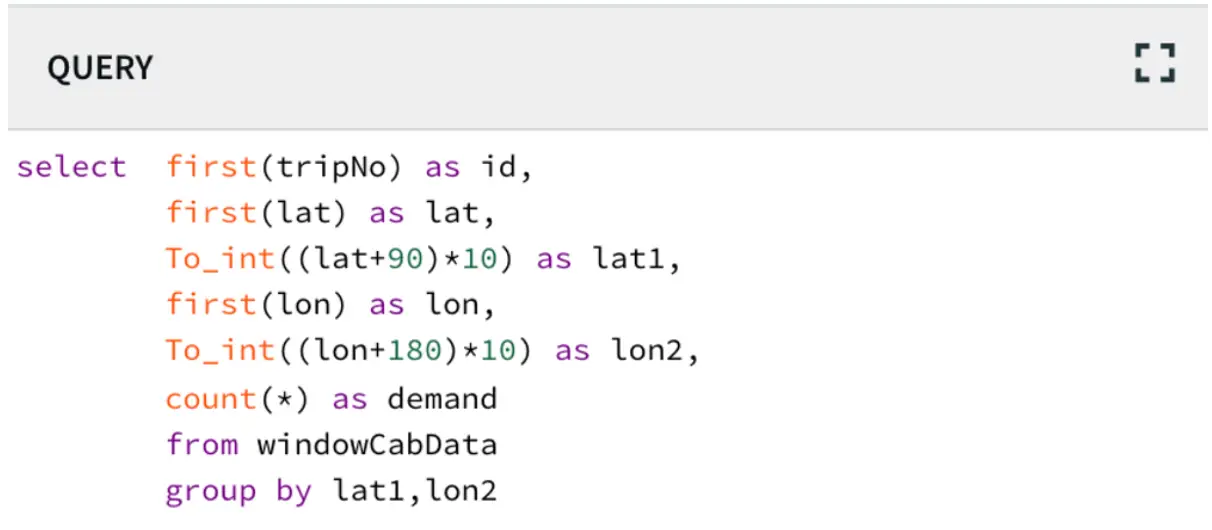
at NYC. The goal is to stream the data through Striim’s CDC platform and detect the areas that have more bookings (hotspots) every 30 minutes. The latitude and longitude value was converted using the following query to cluster them into certain areas
The following steps were followed before deploying the app
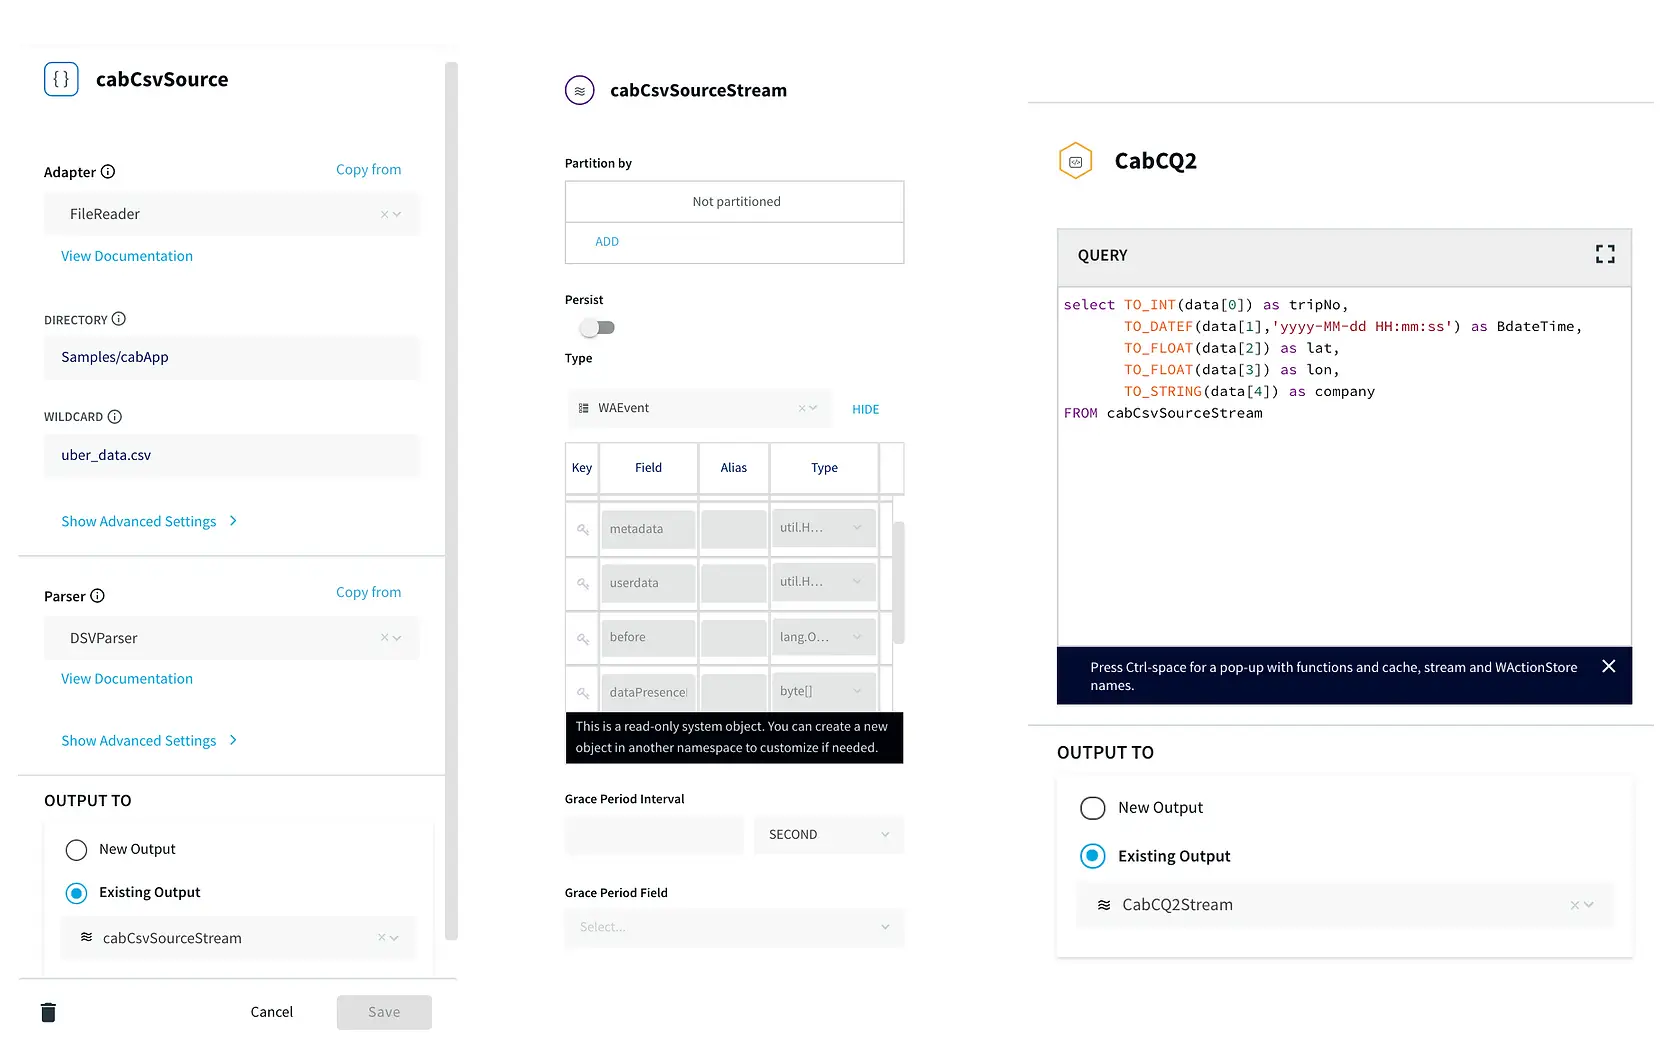
Step 1: Reading Data from CSV and Streaming into Continuous Query through stream
In this step, the data is read from the data source using a delim-separated parser (cabCsvSource) with FileReader adapter used for CSV source. The data is then streamed into cabCSvSourceStream which reaches cabCQ for continuous query. The SQL query at CabCQ2 converts the
incoming data into required format
Step 2: Sending the data for processing in Striim as well as into BigQuery
The data returned from the continuous query is then sent for processing through a 30-minute window and also migrated to BigQuery for storage. This is a unique feature of the Striim platform that allows data migration and processing at the same time. The data transferred to
Bigquery can be used by various teams for analytics while Striim’s processing gives valuable insights through its dashboard.
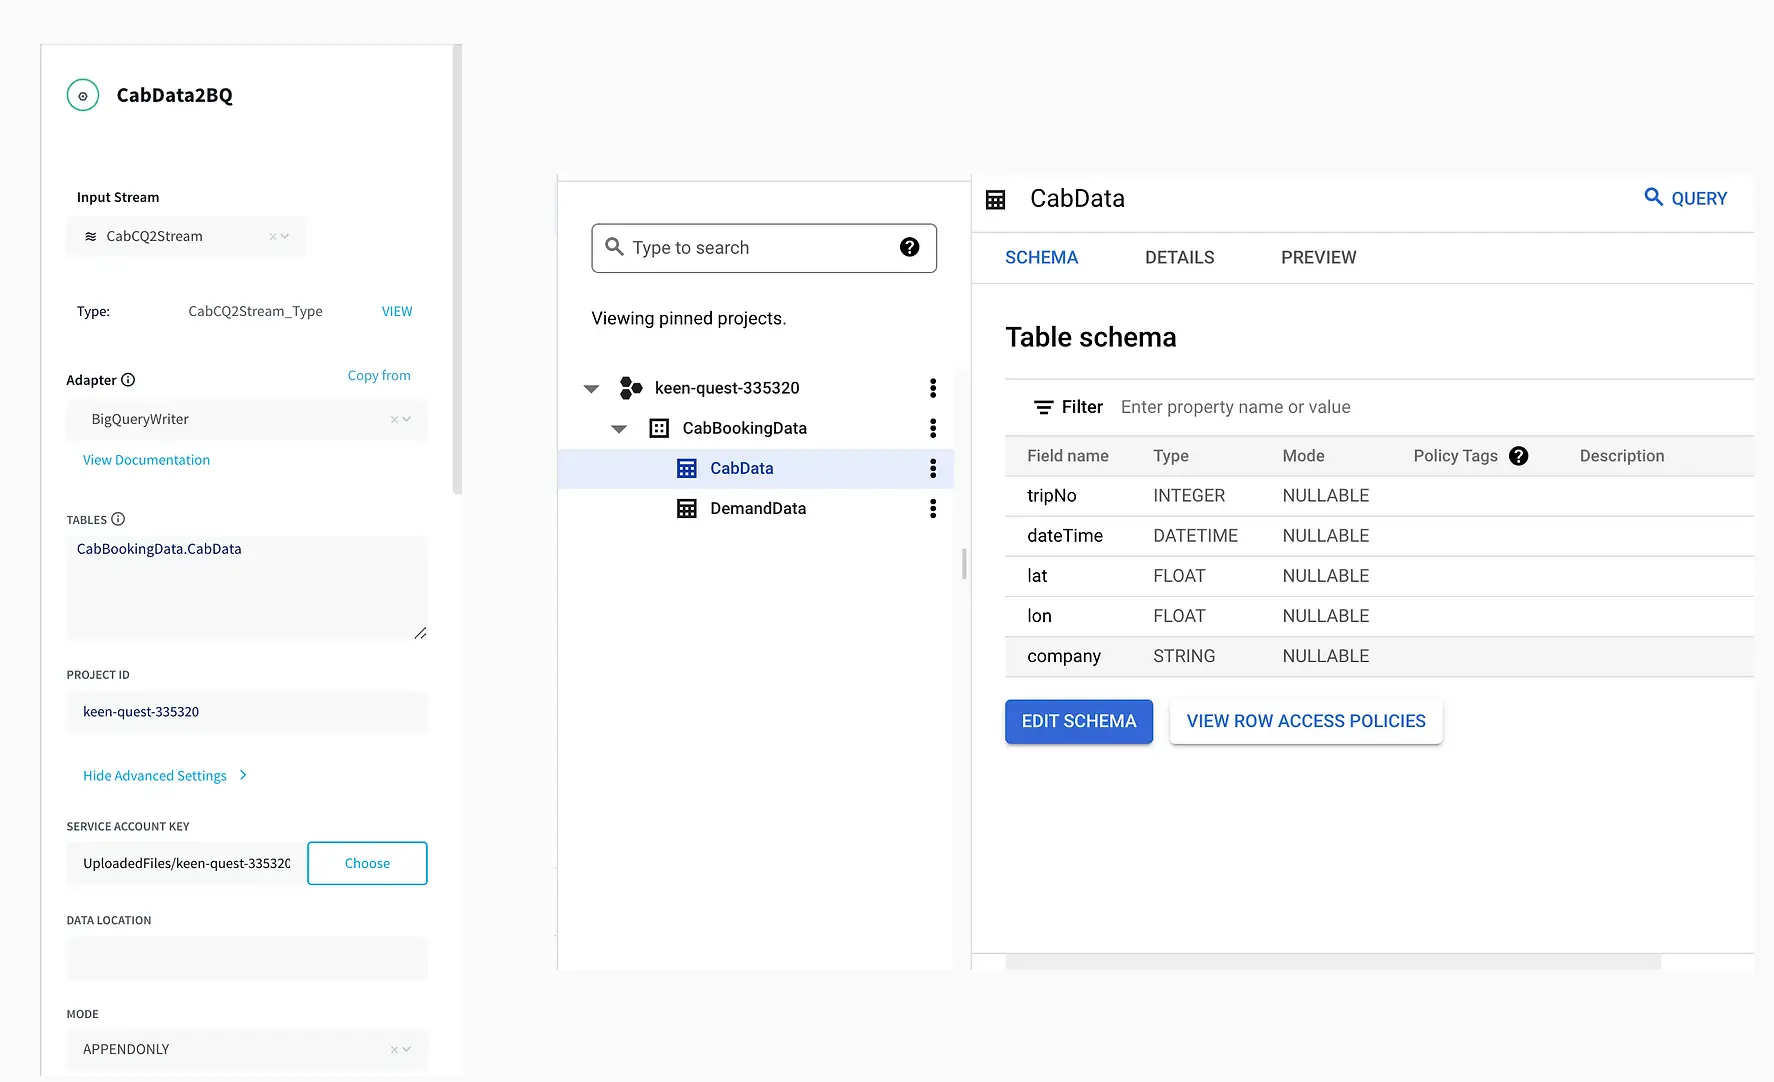
The connection between Striim and BigQuery is set up through a service account that allows Striim application to access BigQuery. A table structure is created within BigQuery instance that replicates the schema of incoming stream of data.
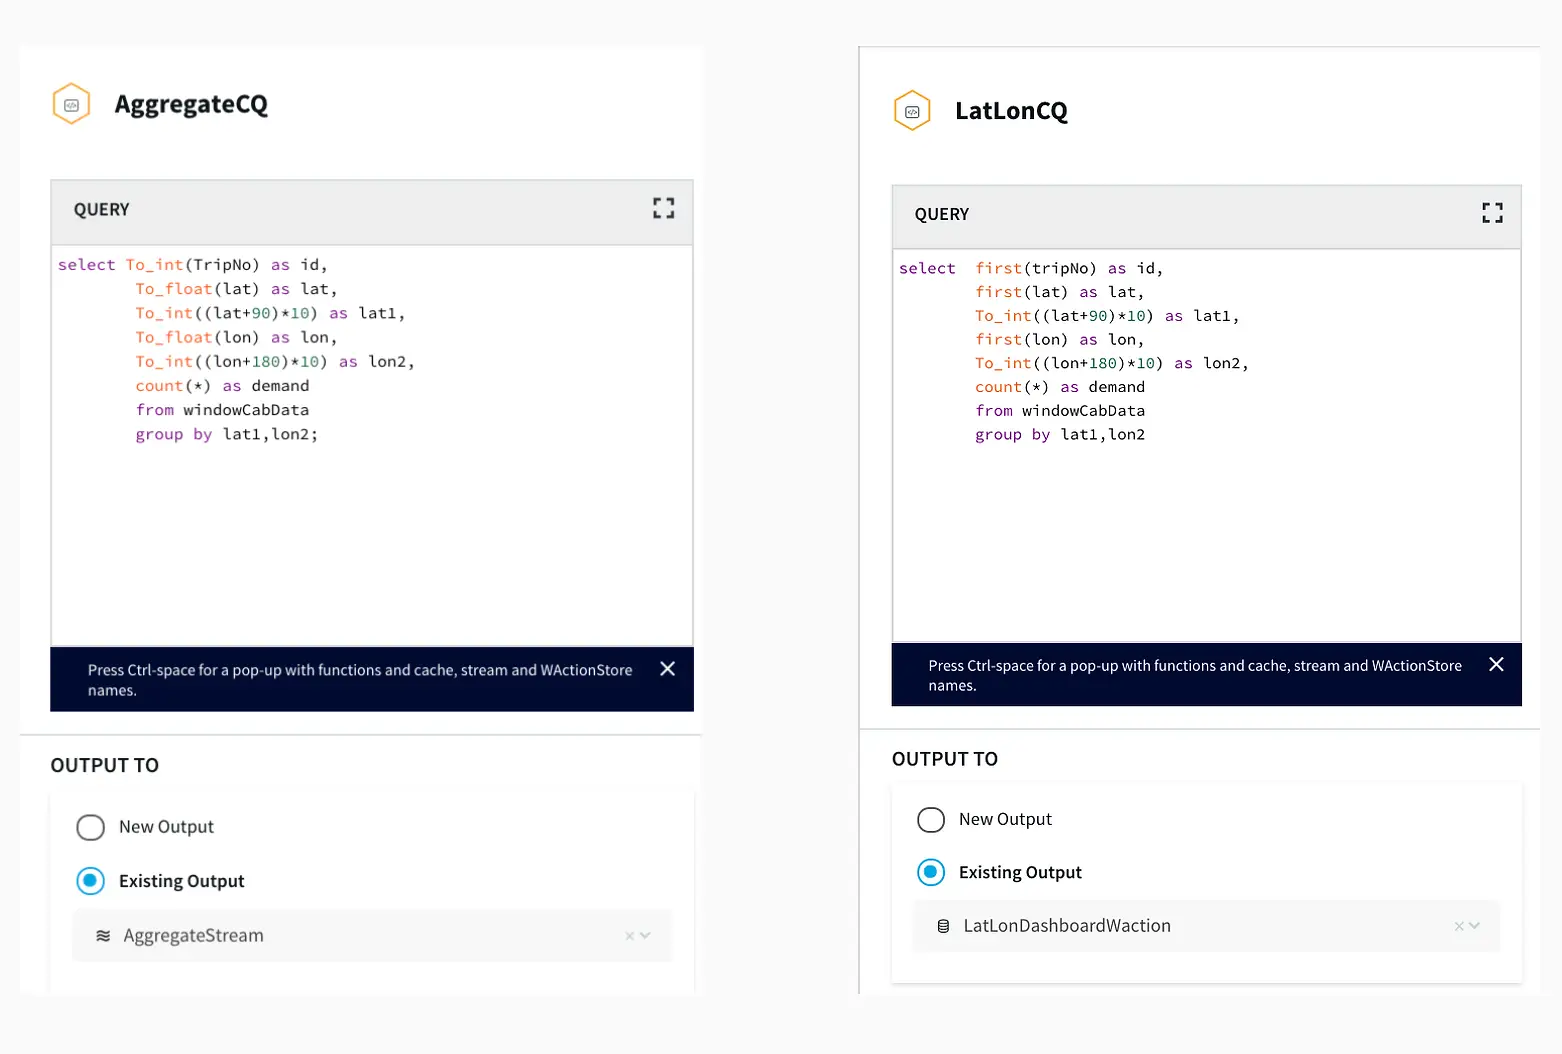
Step 3: Aggregating Data using Continuous Query
After the data is captured, a query is applied on each window that clusters the latitudes and longitudes of pickup locations into discrete areas and returns the aggregate demand of each area in those 30 minutes. There is a slight difference between the clustering query that
goes into BigQuery(AggregateCQ) and the one that goes into StriimWaction(LatLonCQ). The data in StriimWaction is used for dashboard tracking hotspots, so the first latitude and longitude value is taken as the estimate of area. The data that goes into BigQuery returns all latitude longitude values and
could be used for further analytics.
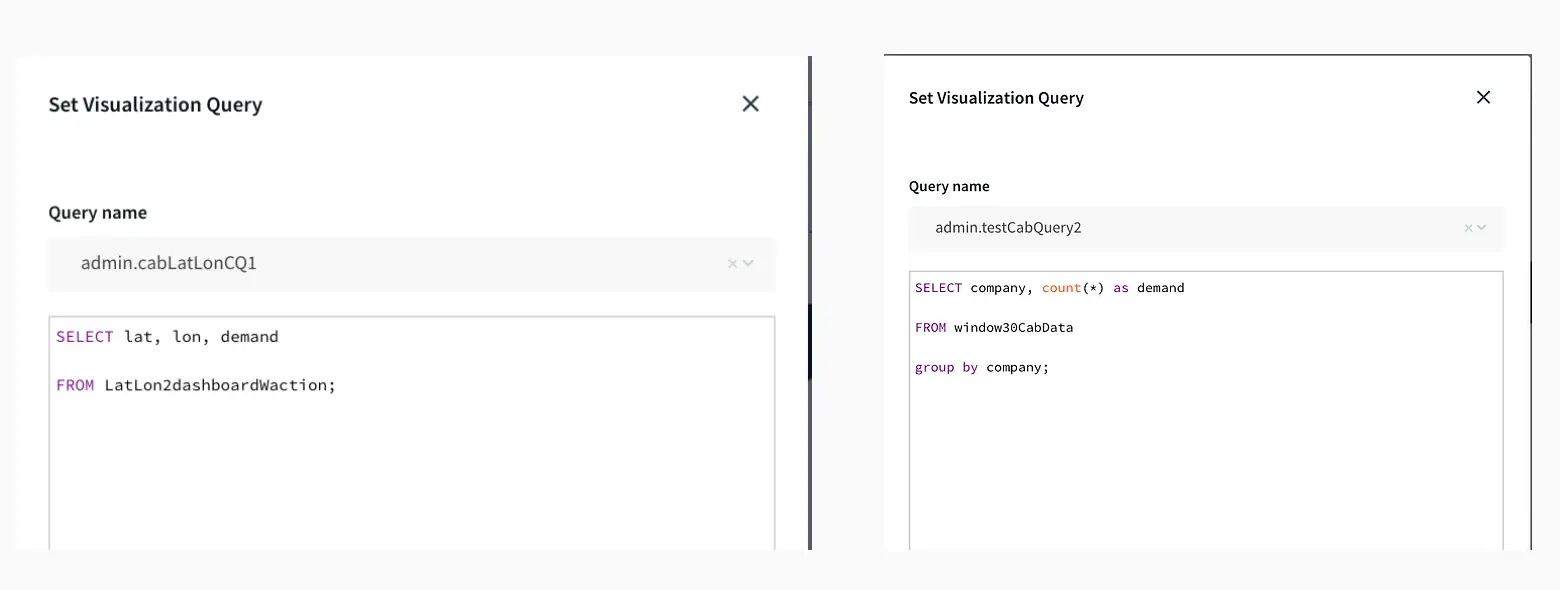
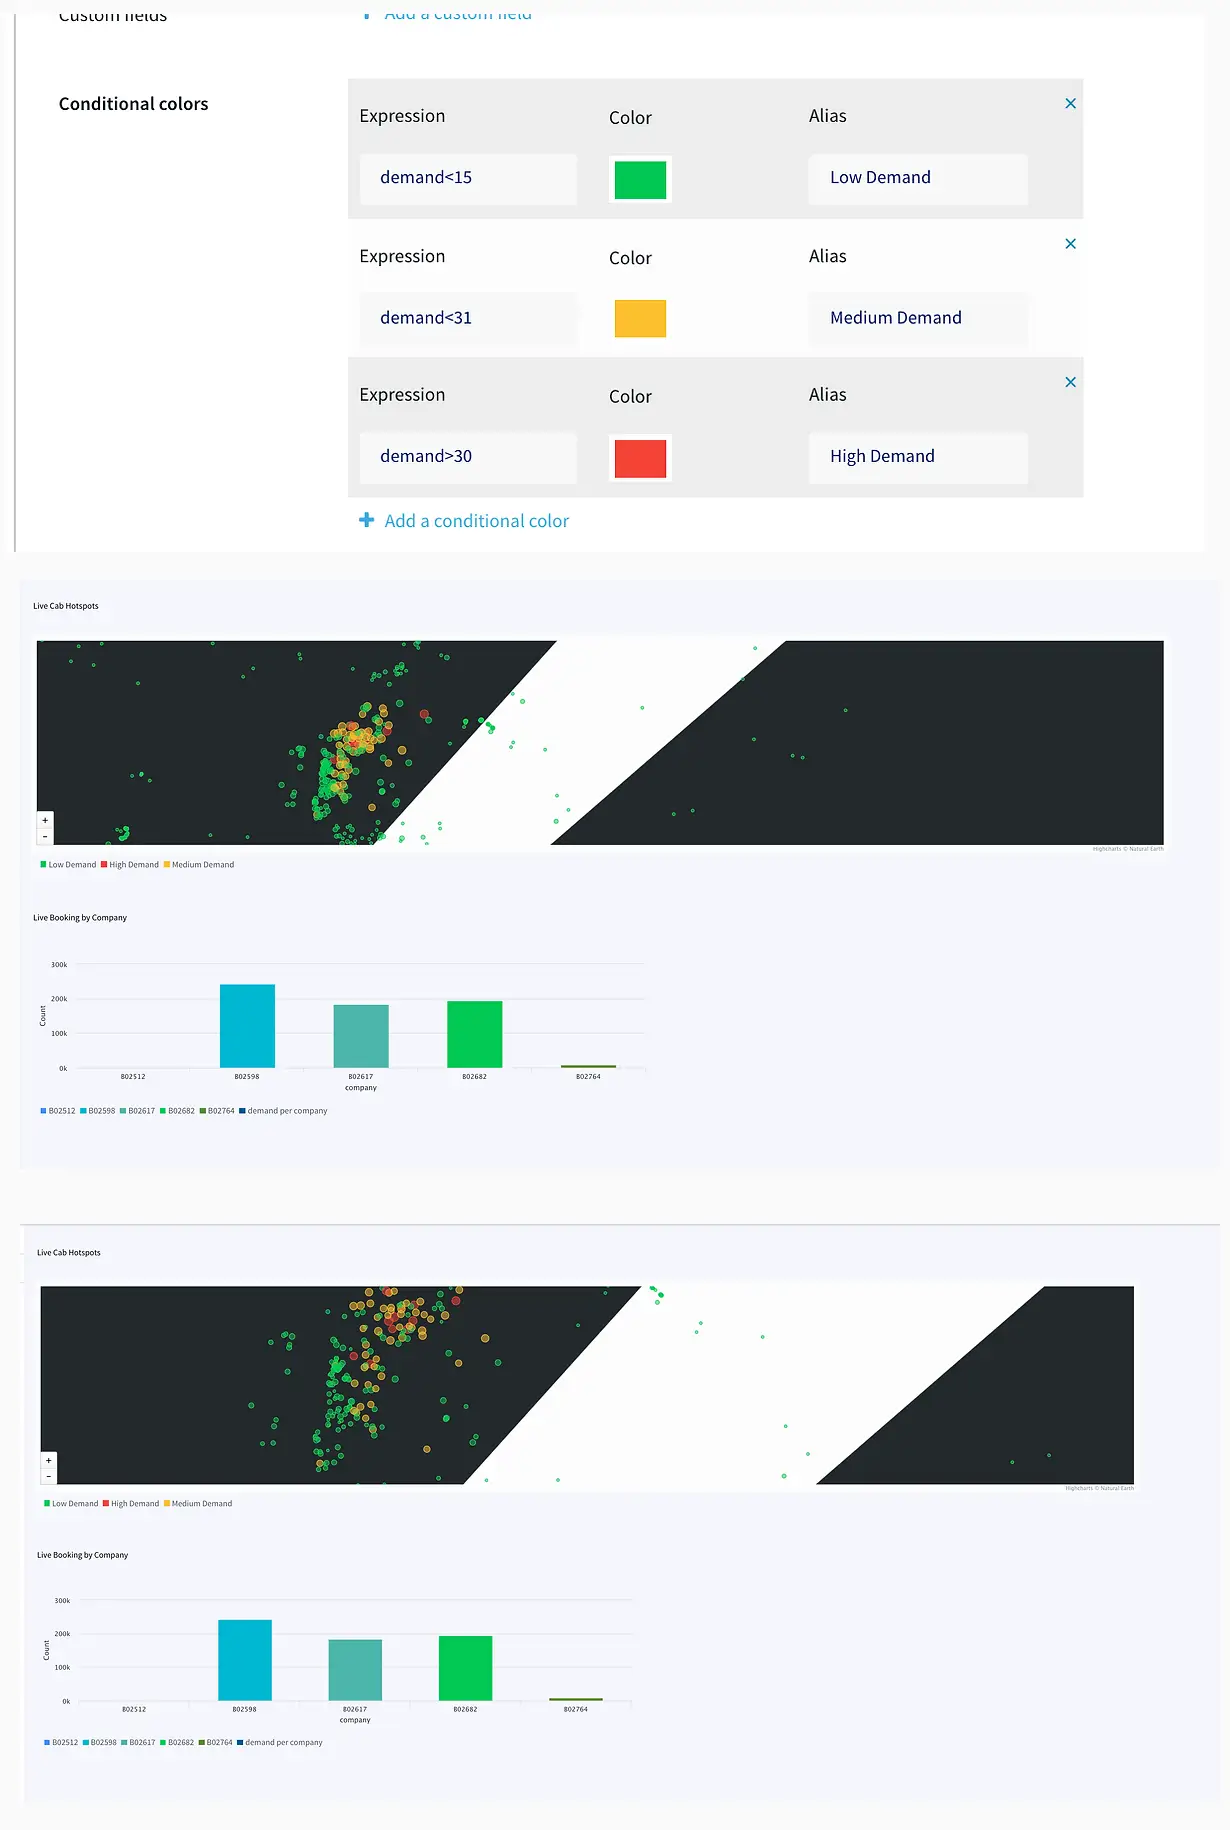
Striim’s Dashboard for Real Time Analytics
The dashboard ingested data from two different streams. The window30CabData provided data to the bar chart that tracked the number of vehicles from each company every 30 mins and the vector map fetched data from LatLon2dashboardWaction that had the aggregated count of bookings
for every area in a 30-minute window. As seen from the dashboard snippet below, the dashboard was configured to return red for high demand (>30), yellow for medium demand (between 15-30), and green for low demand(less than 15). This can be very useful to companies for real-time tracking analytics
and
data migration. The dashboard has two components, a query where data is fetched from the app and processed as required. The other component is configuration, where specifications on visualization are entered. The SQL queries below show the query for the vector map and bar chart. The two snippets
from the
dashboard show an instant of booking at different locations and the number of vehicles from each TCL company.
Migrating Data to BigQuery
Finally, the aggregated data along with the source data was migrated to BigQuery. Migration to BigQuery followed the same process of creating a table schema that mirrored the structure of incoming data from Striim.
Flowchart
Below is the UI of cabBookingApp that tracks bookings within a given time window and returns aggregated demand in a Striim dashboard. The app also streams data from source to BigQuery .
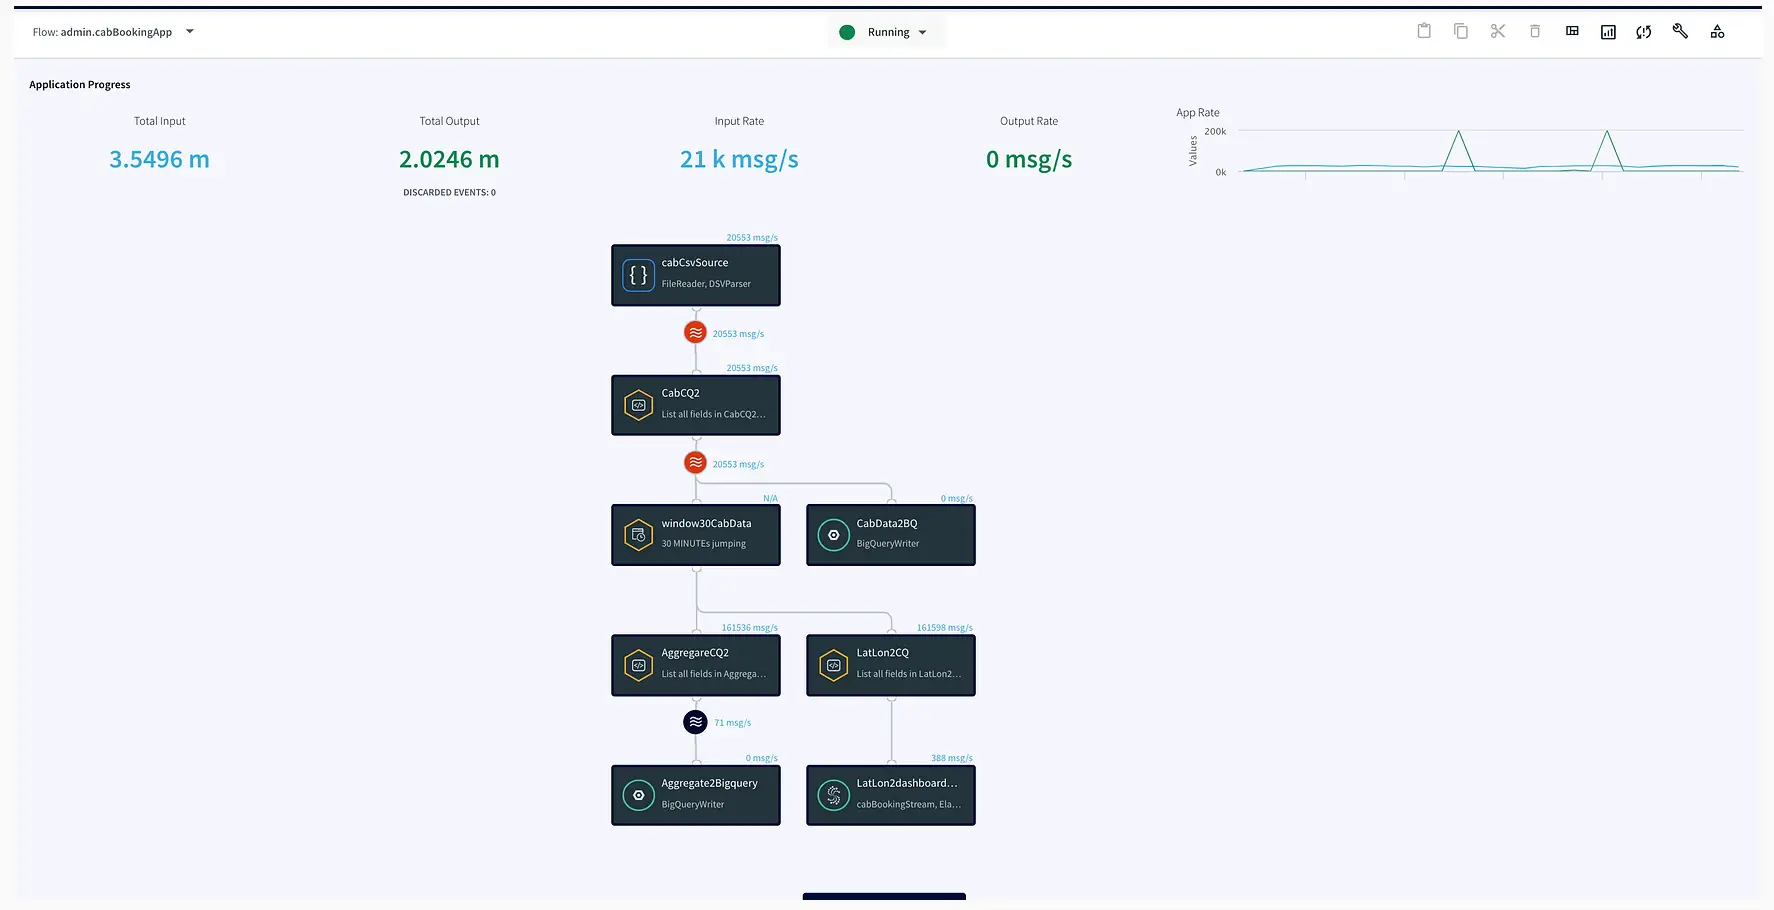
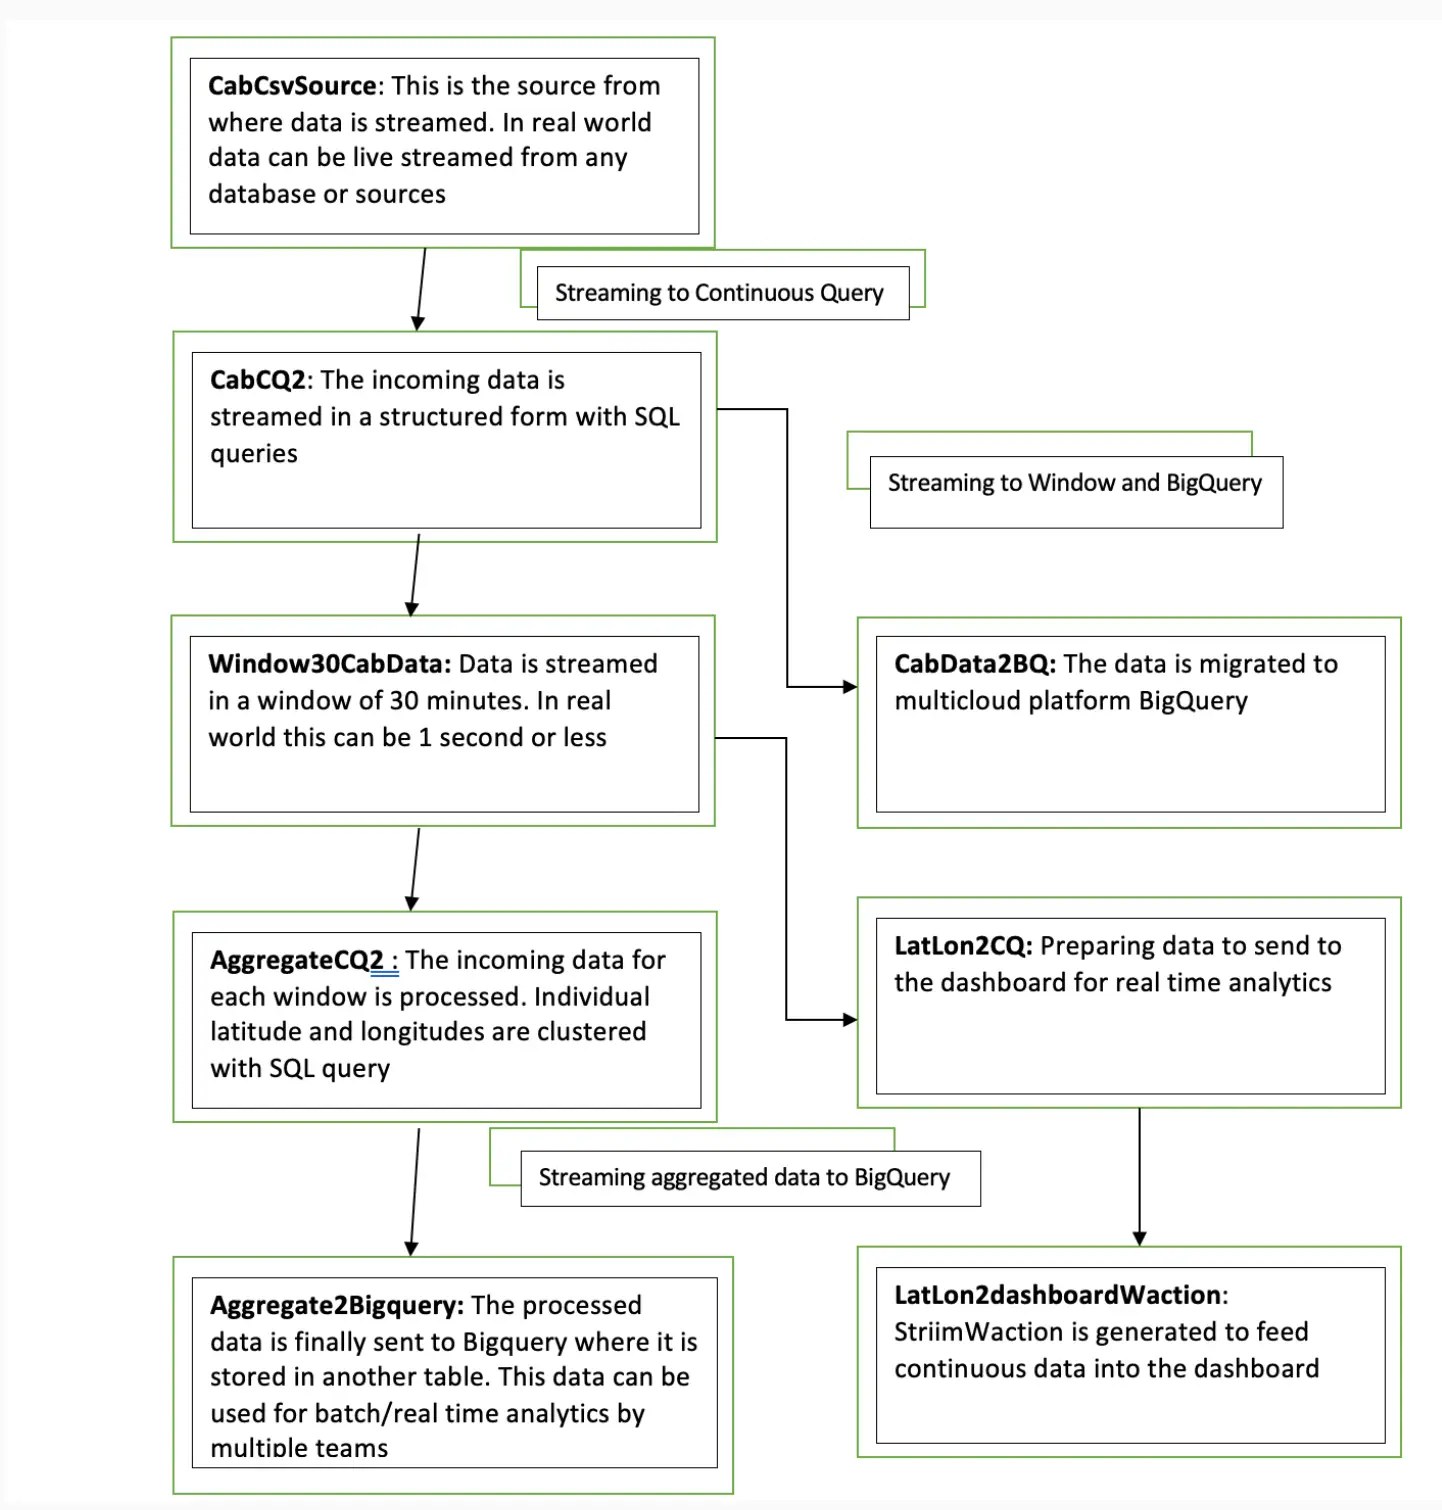
Here is an overview of each component from the flowchart:
Setting Up the Tracking Application
Step 1: Download the data and Sample TQL file from our github repo
You can download the TQL files for streaming app and lag monitor app from our github repository. Deploy the Striim app on your Striim server.
Step 2: Configure your CSV source and BigQuery target and add it to the source and target components of the app
You can find the csv dataset in our github repo. Set up your BigQuery dataset and table that will act as a target for the streaming application
Step 3: Follow the recipe to create Striim Dashboard for real-time analytics
The recipe gives a detail on how to set up a Striim dashboard for this use case
Step 4: Run your app and dashboard
Deploy and run your app and dashboard for real-time tracking and analytics
Why Striim?
Striim is a single platform for real-time data ingestion, stream processing, pipeline monitoring, and real-time delivery with validation. It uses low-impact Change Data Capture technology to
migrate a wide variety of high-volume, high-velocity data from enterprise databases in real-time. Using Striim’s in-flight data processing and real-time dashboard, companies can generate maximum value from streaming data. Enterprises dealing with astronomical data can incorporate Striim to maximize profit with real-time strategic decisions. Striim is used by companies like Google, Macy’s, and Gartner for real-time data migration and analytics. In this data-driven age, generate maximum profit for your company using Striim’s CDC-powered platform.
To learn more about Striim for Google BigQuery, check out the related product page. Striim supports many different sources and targets. To see how Striim can help with your move to cloud-based services, schedule a demo with a Striim technologist or download a free trial of the platform.

Striim
Striim’s unified data integration and streaming platform connects clouds, data and applications.
Google BigQuery
BigQuery is a serverless, highly scalable multicloud data warehouse.