


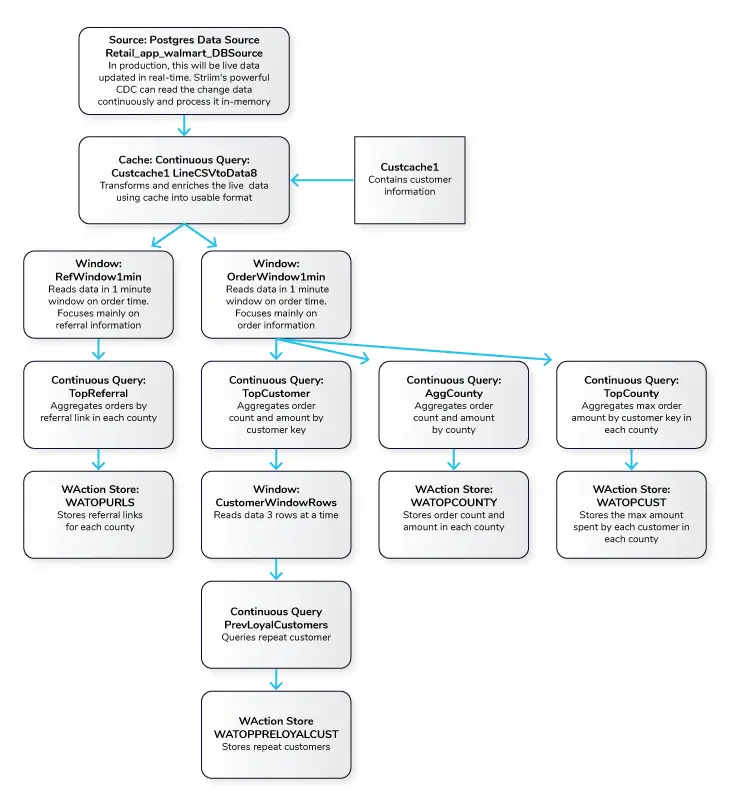
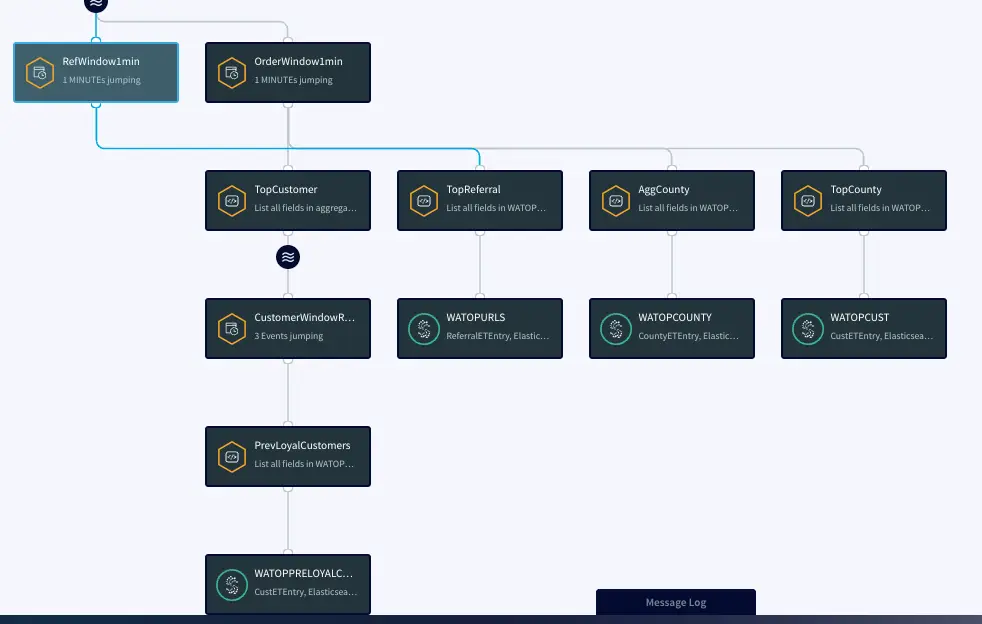
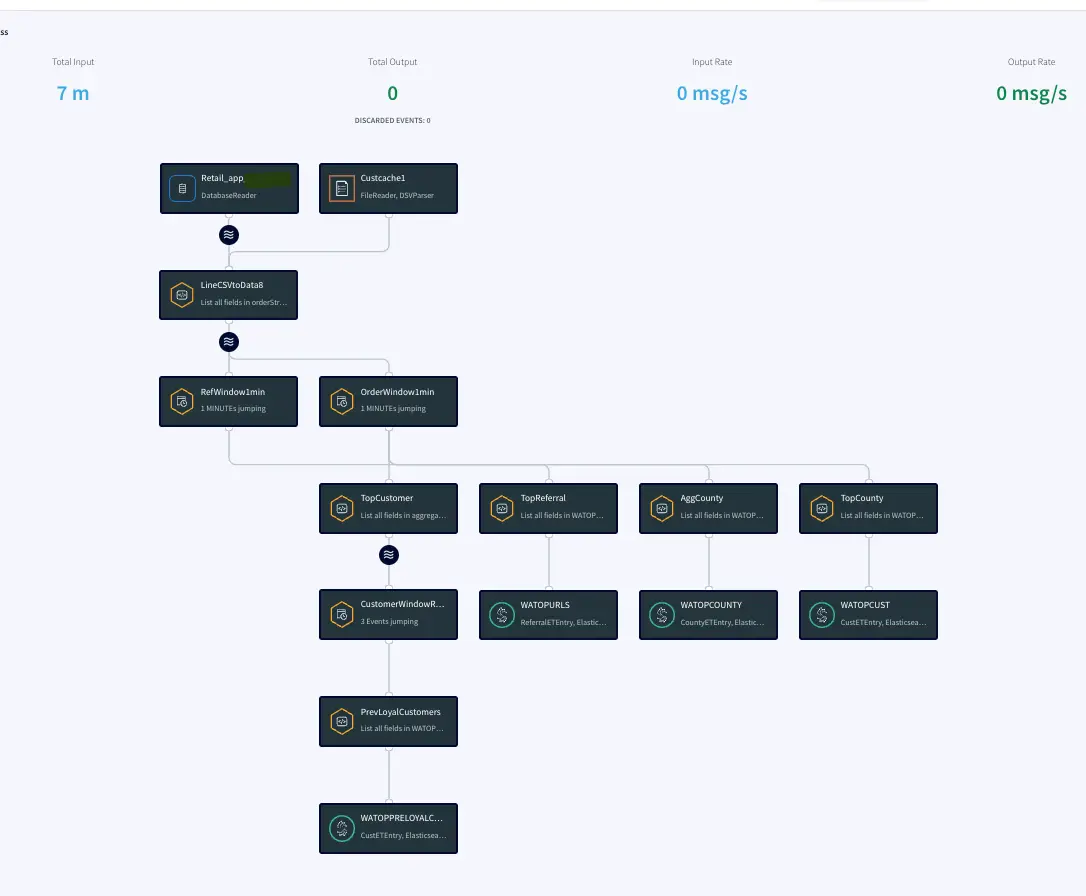
Simplified Diagram of the Striim App
The Retail app in this recipe reads data from PostgreSQL Database and processes it into a usable format. The data is enriched using a cache containing customer details and then transformed using Continuous Queries. The transformed data is streamed with a one-minute window on order time which is further processed and stored in WActionStores. The data from the WAction component is used to populate a dashboard that shows top spenders, referrals and counties. In the production environment, data will be continuously updated on the source database which could be read with Striim’s Change Data Capture for real-time insights.
Step 1: Read Retail Data from Postgres Reader and process using CQ
For this recipe we are reading data from Postgres Database. The dataset can be found on our github repo. The data is read once and queried in a one-minute window. In production, this would be live streaming data from different sources at different locations. The metadata is processed and enriched using customer cache data and the Continuous Query Striim component.

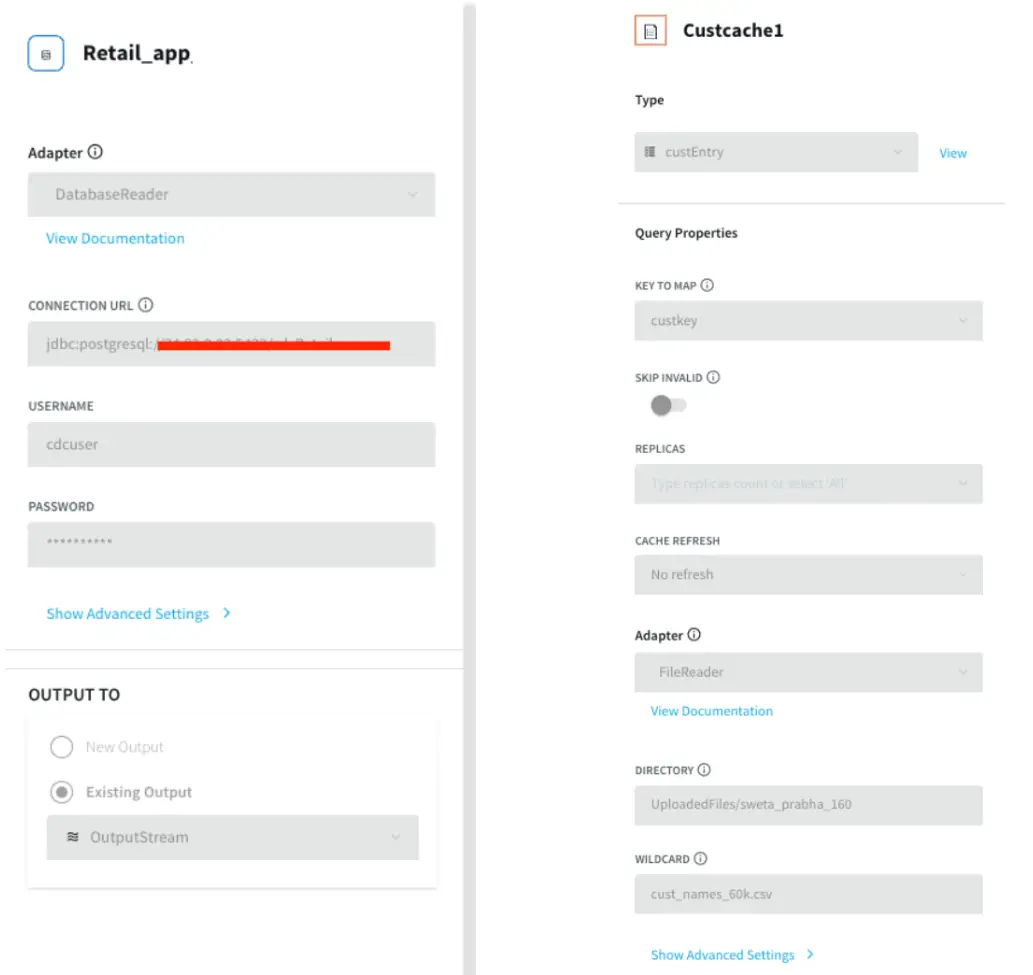
Postgres Source and csv cache: We specify the endpoints, username and password of the source Postgres database. The Cache will cache a dataset in Striim Cloud so it can be joined with a Stream using SQL.
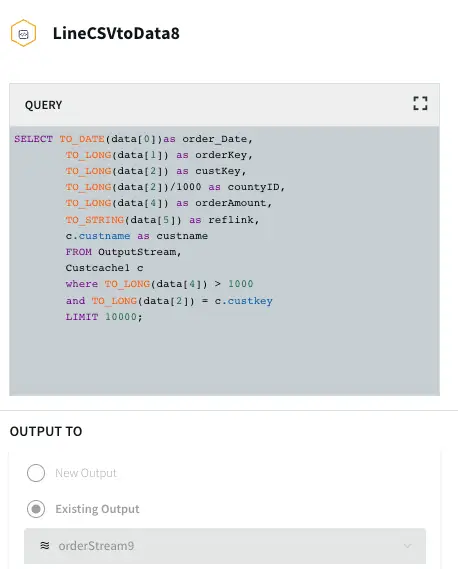
Initial Data Processing and Enrichment: The Continuous Query, LineCSVtoData8 is used to change the datatype for each field in usable format and merge the customer name from cache.
Step 2: Split data into one-minute window on Order time
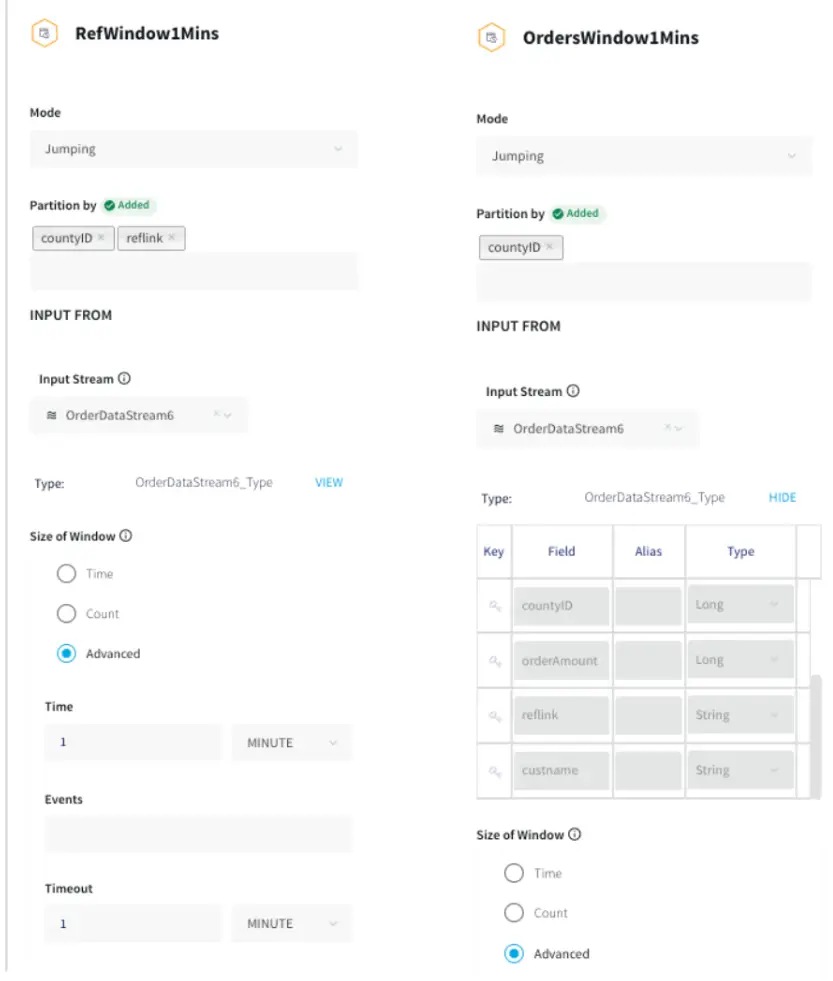
The processed data stream is split into one-minute chunks. The Window component in Striim creates a bounded dataset by a specified number of events, a period of time, or both. In this recipe, the incoming steam contains order data. There are two window components as shown below. Both the windows have jumping mode which means data is periodically updated for 1 minute interval. For RefWindow1Mins window, we have partitioned the datastream by reference link for every county. The partition by option on a time based window starts the timer separately for each. field value. The OrdersWindow1Mins partitions the data stream on countyID.
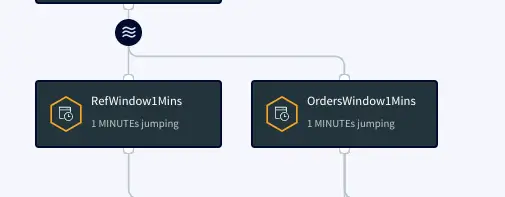
The timeout of one minute under Advanced Window settings forces the window to jump within a set period. To prevent the window from opening over longer time gaps between events, a timeout value is provided.
Step 3: Aggregate data using CQ on various fields
In this section continuous queries are written on orders and referral streams to aggregate data by top referral urls, top selling counties, top customers, and loyal customers. The data is then stored in the WAction component which is used to populate the Striim dashboard.
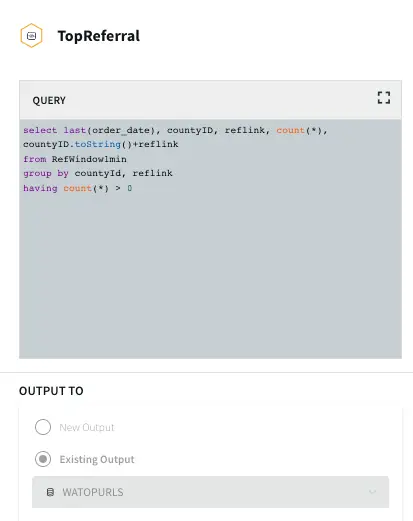
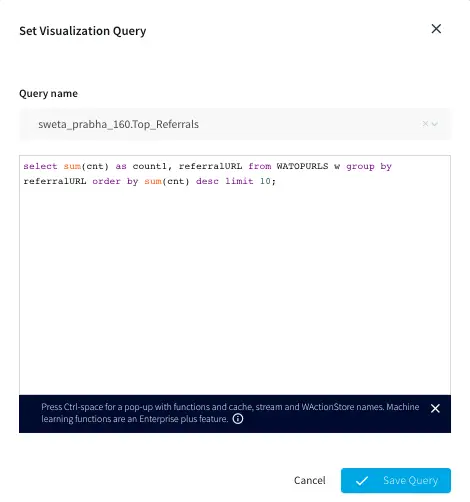
Top Referral links: The CQ counts the number of orders placed through various referral links in each county. The aggregated data is then stored in a WAction store which will be used in the Striim dashboard.
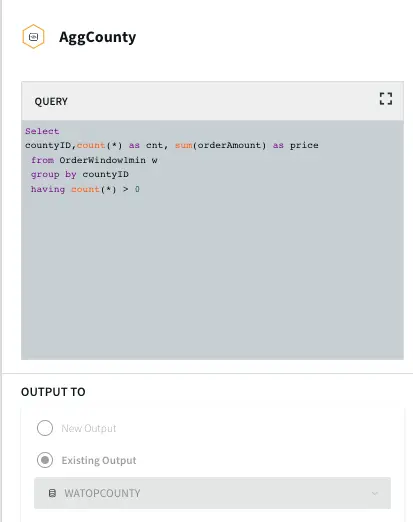
Aggregate County: In this query the total order amount and order count from each county is recorded.
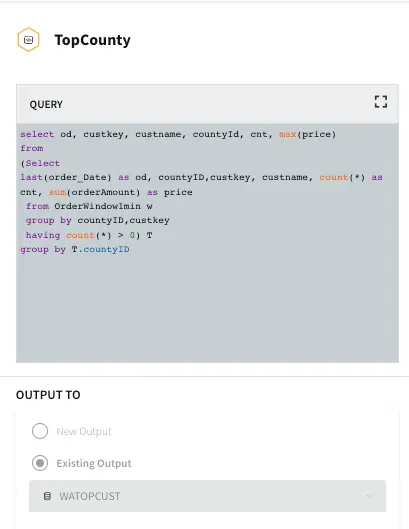
Top County: In this query the maximum order amount from customers in every county is recorded.
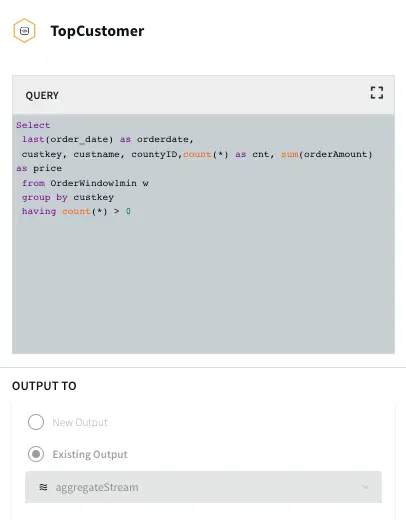
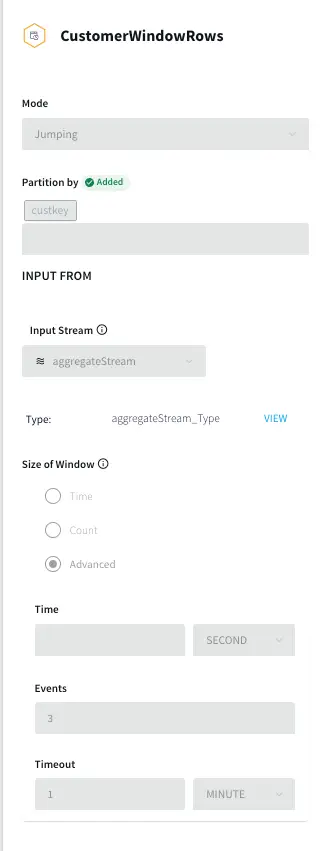
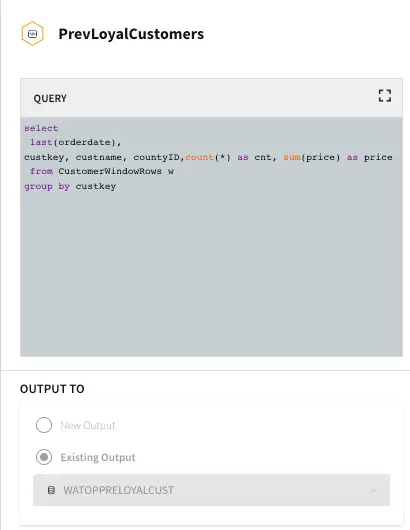
Top Customer: In this app, the order count and order amount of each customer is queried which is then partitioned to 3 events window with partition on customer key. The total order amount by each customer in a 3 event window is calculated. The data is then stored in WAction to analyze the top loyal customers with repeat orders.
Step 4: Populate the dashboard with data from WAction Stores
In this step a Striim dashboard is configured. Click on the Dashboards option on your service page as follows:
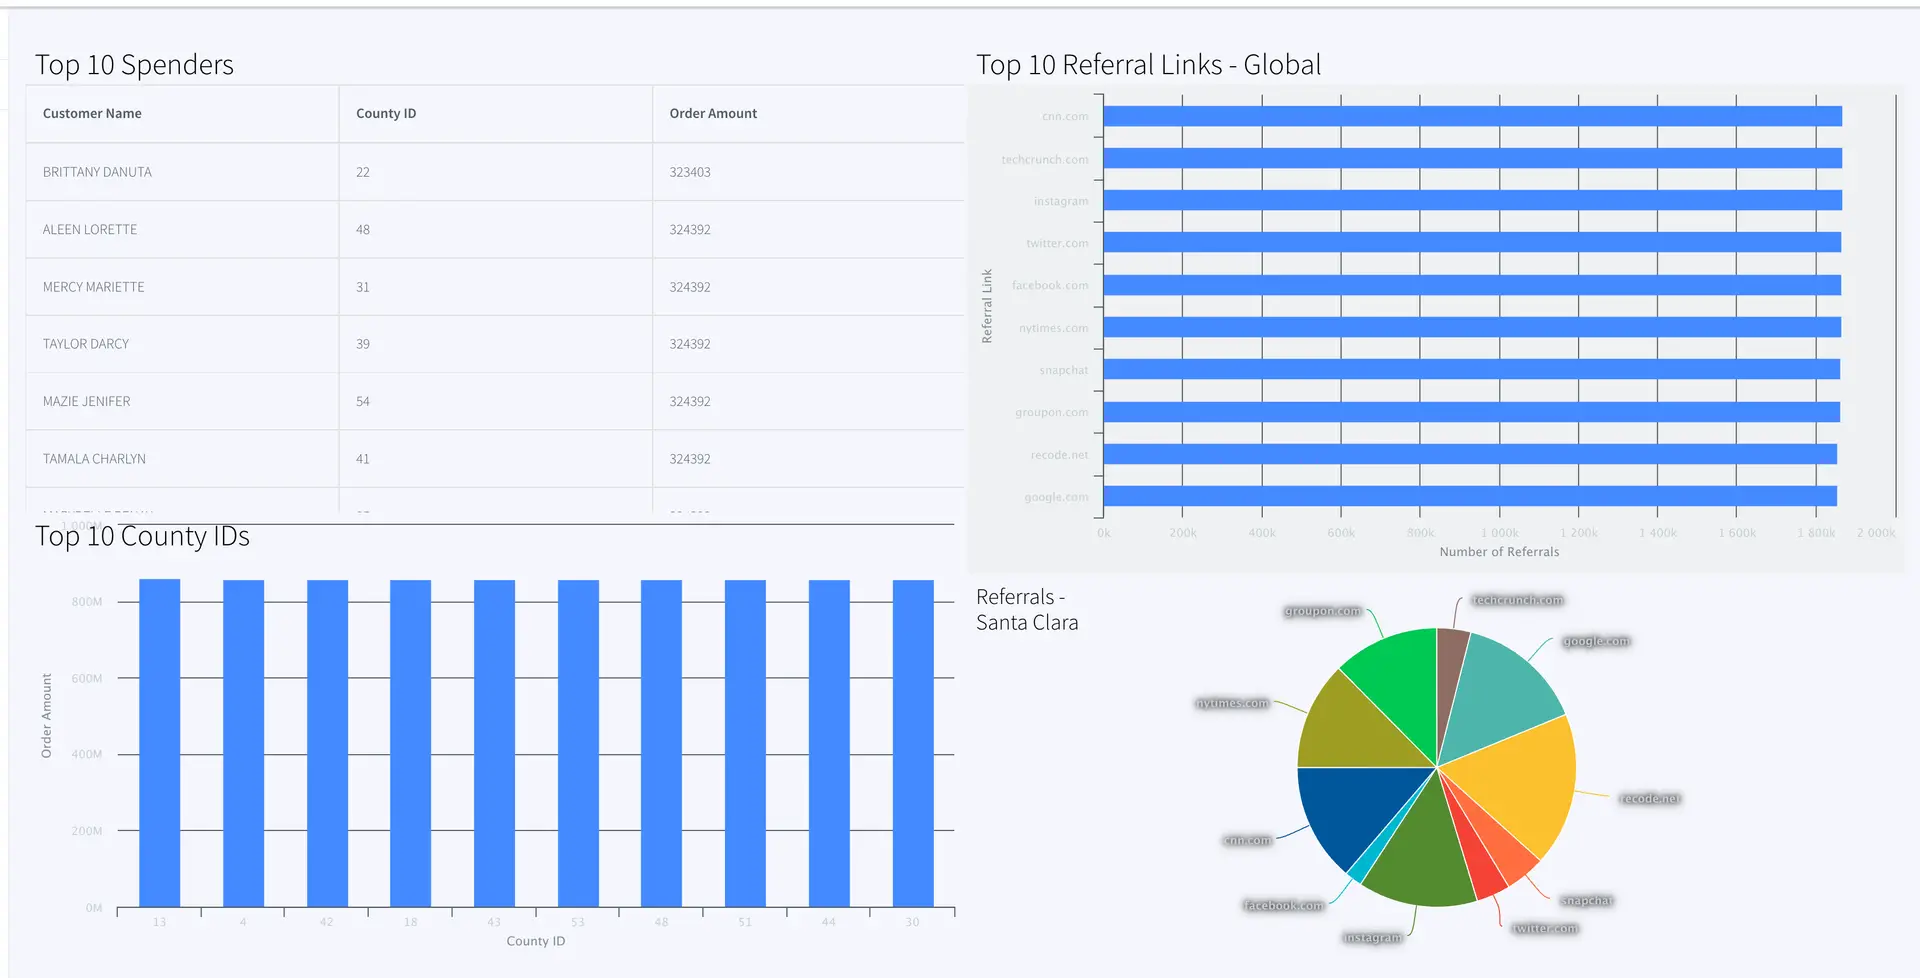
For this recipe, we have created two bar charts, one pie chart and one table. There are many more options to visualize data on the Striim dashboard. Please follow our dashboard guide to learn about various dashboard options in Striim.
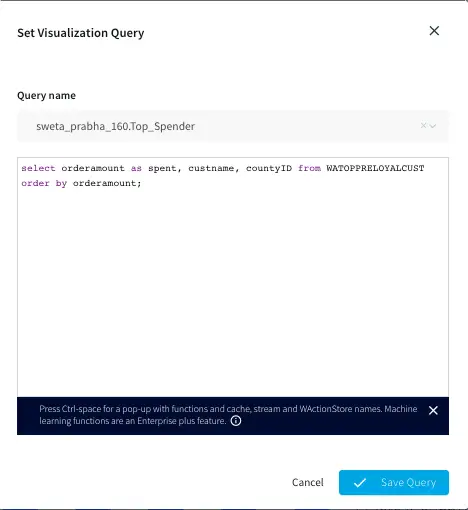
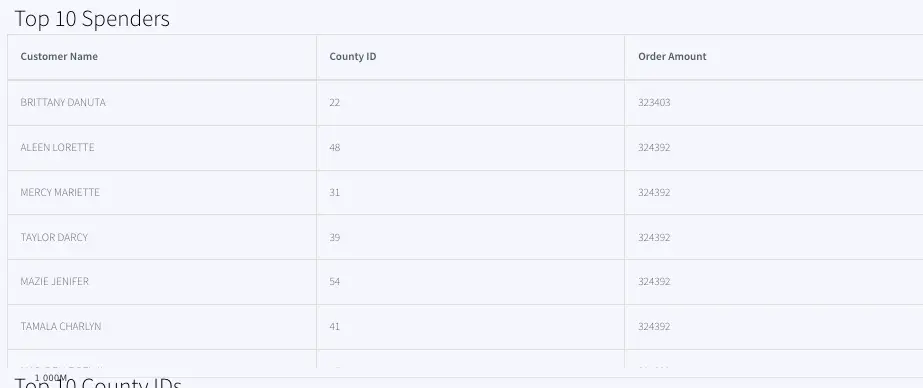
Top 10 Spenders:
The Top 10 Spender table shows the county id, customer name and order amount of customers with the highest order amount. The data is pulled from WATOPPRELOYALCUST WAction store and ordered by orderamount.
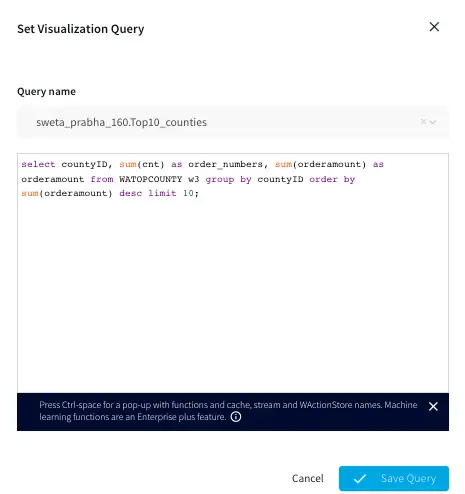
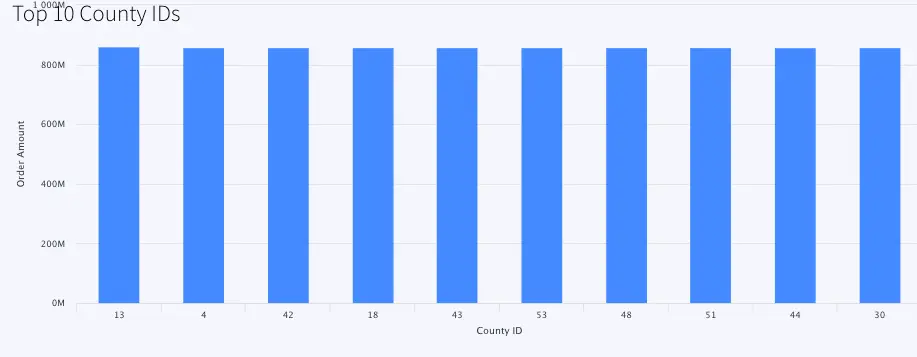
Top 10 County IDs:
This is a bar chart that reads data from WATOPCOUNTY and orders by amount sold in each county.The top 10 county ids with total order amount are shown in the bar chart.
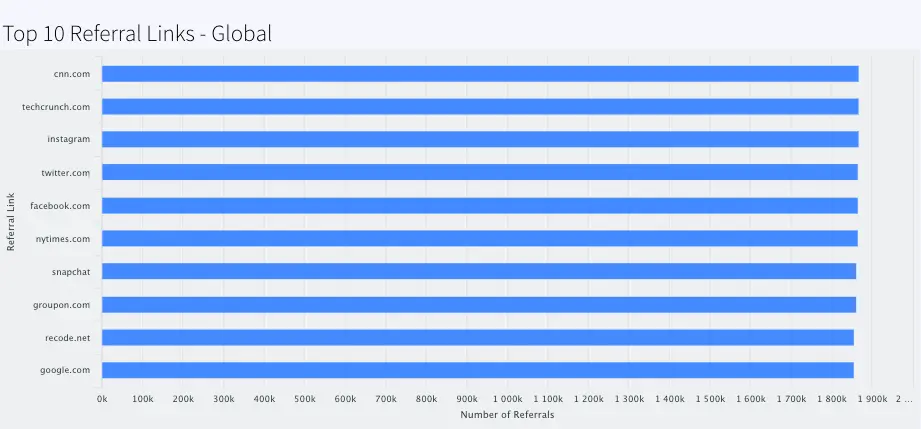
Top 10 Referral Links-Global:
This barchart shows the top 10 referral links through which orders are placed.
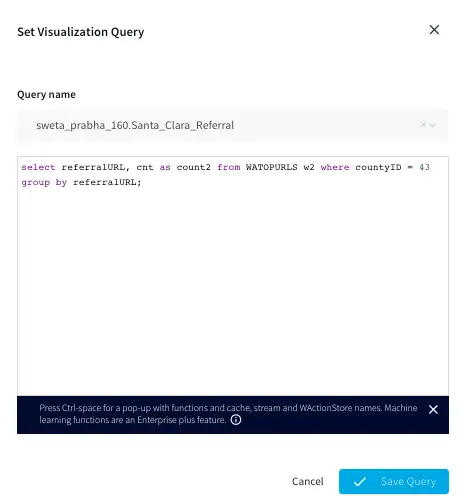
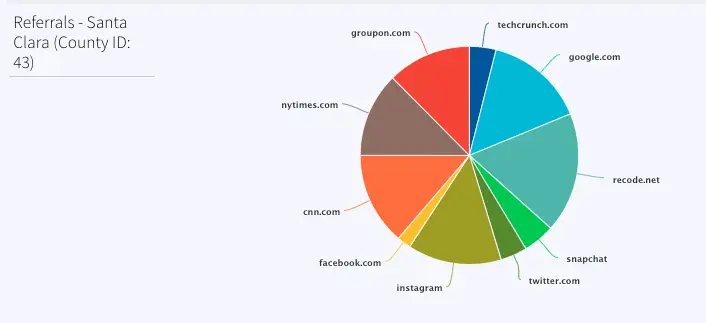
Referrals- Santa Clara (County ID: 43)
This pie chart shows the referral links for order counts sold in Santa Clara county (County id: 43). Most orders were placed through google.com, instagram and recode.net.
Final App and Dashboard

Striim
Striim’s unified data integration and streaming platform connects clouds, data and applications.
PostgreSQL
PostgreSQL is an open-source relational database management system.