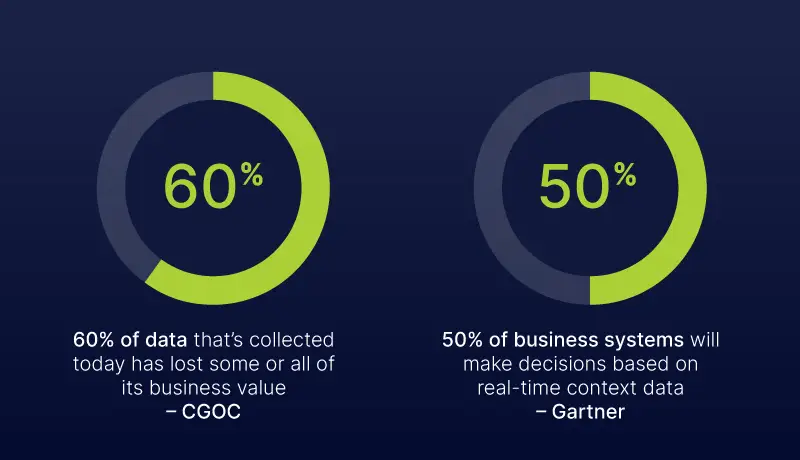
According to CGOC, 60% of data that’s collected today has lost some or all of its business value. Trends change rapidly; if an organization uses last month’s data to make a decision for a current problem, they may draw an erroneous conclusion, formulate the wrong response, or worse.
Today, organizations must respond to the real-time demands of their business by overhauling their data infrastructure. In this age of smartphones and IoT devices that work in real time, analyzing historical data in batches for all business tasks is not good enough. They need to do more by getting instantaneous insights through real-time analytics. This can help them to understand their customers better and respond to market changes quickly. According to Garner, by this year, more than 50% of business systems will make decisions based on real-time context data.
Real-Time Analytics Use Cases
The emergence of real-time analytics has allowed organizations to collect data from user interactions, machines, and operational infrastructure in real time. They can now act on data immediately — soon after it makes its way to their systems. This can help businesses earn a competitive edge by offering a broad array of use cases in different industries, including detecting fraud in finance, increasing the speed at which goods are delivered in the supply chain, and optimizing the management of inventory in manufacturing.
Real-Time Analytics for Supply Chain
Real-time analytics can be useful for addressing efficiencies in the supply chain. These inefficiencies are costly; they led to almost a loss of $2 billion in the UK. The supply chain industry has a complicated ecosystem due to the presence of several channels — both offline and online — and participants, such as vendors and manufacturers.
Supply chain management is always looking to improve cost savings, speed, and productivity, but the lack of real-time integration between all the external and internal stakeholders is a challenge. There’s also the equipment failure dilemma — a piece of equipment or machine is always vulnerable to failing at a critical time. Lastly, data related to supply and demand isn’t always reliable with batch processing since batch data can be a few hours (or days) old.
With the introduction of real-time analytics, the discussion has moved from merely automating processes to integrating data in real time and using it to make better decisions. Now, it’s possible to view real-time data feeds to manage the supply chain and plan better for demand and supply. Perhaps that’s why around 66% of supply chain leaders think that the use of analytics will be of critical importance to their operations in the future.

Optimizing route and train drivers
Logistics fleet managers can use real-time analytics to track shipping fleets and trucks, improve route optimization, and prevent bottlenecks, such as traffic issues, to ensure the swift and safe delivery of goods.
Modern data analytics software for transportation and logistics optimizes routes through a route planning algorithm. A route planning algorithm is fed real-time data to find the most affordable, efficient, and fastest route of delivery. For example, these algorithms can analyze real-time data on fuel consumption, weather conditions, and traffic patterns on key roadways to revise routes, minimize delivery time, and reduce the frequency of damaged and expired products. This is beneficial for drivers as well, as they can save time and avoid hurdles during their routes.
Over time, when real-time data is continuously aggregated, it can help to spot recurring issues faced by drivers. Many companies collect real-time data on fuel by installing fuel-level sensors in their vehicles. These sensors can provide data on fuel consumption, fuel level volumes, and locations and dates of refills. For instance, if two drivers drive on the same route and the sensors convey that one of them is using significantly more fuel, then the fleet manager can look into the matter.
Fleet managers can also use an electronic logging device (ELD) for driver behavior analytics. For instance, you can use an accelerometer and gyroscope with ELDs to collect real-time information on collision, braking, and harsh turning. This way, you can create awareness of safe driving among your drivers and avoid potential catastrophic future events by sending details to drivers about areas having dangerous turns.
Reducing operational risks
You can use real-time analytics to mitigate operational risks. Sometimes, there are unscheduled fleet or factory maintenance requirements that can hinder operations in the supply chain. With real-time analytics, data science–based methods can help you with estimating when your equipment might fail. For this purpose, thermal imaging, vibration analysis, infrared, and acoustics are used. Real-time analytics takes advantage of these technologies to measure and collect operations and equipment data in real time via remote sensor networks (e.g., oil sensors to detect debris from wear). This can help minimize maintenance costs.
For example, you can use an accelerometer to collect data for vibration analysis in your real-time analytics system. The accelerometer produces a voltage signal that shows the frequency and amount of vibration the machine is generating every minute or second. These signals are transformed as a fast Fourier transform (amplitude vs. frequency) or time waveform (amplitude vs. time).
With real-time analytics, vibration analysts can review this data through algorithms and assess the machine’s health and detect potential issues, such as electrical motor faults, misalignment, mechanical looseness, bearing failures, and imbalance. This also ensures that your technicians don’t always have to be in proximity to your factory for routine maintenance. In addition, it helps to know what issue your machine is facing, which can save a lot of time.
Improving supply and demand
Traditionally, supply chain management used enterprise resource planning (ERP) systems and disparate storage systems for data. This meant that shared data updates between stakeholders were based on a specific time period (e.g., daily or hourly). Today, supply and demand have constant fluctuations, making it necessary to collect and analyze data from suppliers in real time.
For example, you can view a key inventory metric in your supply chain dashboard: inventory turnover. A higher inventory turnover indicates that your products are moving quickly through the supply chain, and you are meeting the current demand. Similarly, you can analyze the latest sentiment data from social media for demand forecasting.
Real-Time Analytics for Finance
Few industries can use real-time analytics better than the finance industry. That’s because it’s synonymous with large amounts of data, extreme volatilities, and the need for detecting complex patterns in real time. Real-time analytics offers the capability to correlate, analyze, and perform actions on finance-related data like transactional data, company updates, market prices, and trading data. This data comes in large volumes from several sources every millisecond, and acting on it quickly is crucial for financial firms and banks.

Detecting stock market manipulation
Real-time analytics can help to identify trends of manipulation in markets, especially insider trading and price manipulations that are done to gain profit in real time. In stock trading, it’s common to gain profit by using dubious methods, such as insider trading or the artificial deflating/inflating of stock prices. Real-time analytics can be used to collect data from Twitter streams, newsfeeds, company announcements, and other external data streams to identify potential attempts to manipulate the market.
One of the techniques used to identify manipulation in stock pricing is Generative Adversarial Networks (GANs). In this model, a discriminator or a type of classifier is used to separate real data from fake data. A generator model is used to create fake data, which it does by getting feedback from the discriminator. The generator is used to create data that looks like manipulated stock prices, which it uses to train the generator to tell if price data is correct or fake.
Preventing money laundering
The banking sector often struggles with the detection of money laundering and payment fraud. It not only affects the bank financially but also damages its corporate image. Real-time analytics can help banks to use machine learning and Markov modeling to safeguard themselves from fraudulent activities.
Banks can use real-time analytics to transfer their specialized domain knowledge about how fraudulent behavior works to a set of rules that can analyze incoming streams of data in real time.
Markov models are used for modeling systems that undergo random changes. They model the probabilities of different states and identify the rate at which these states transition. This mechanism allows them to be used for recognizing patterns and making predictions — precisely why they are used for fraud detection to find rare transaction sequences. This way, banks can try to identify complex fraudulent activities where experienced criminals break down one transaction into multiple smaller transactions for money laundering.
Real-Time Analytics for Manufacturing
According to a BCG survey, 72% of manufacturer executives find advanced analytics “to be important.” Despite this, only 17% of them have been able to get “satisfactory” value out of it. There’s a lot of room for improvement and a shrewd implementation of real-time analytics can improve your operational efficiency.
Real-time analytics can help you to continuously track, control, and fine-tune manufacturing processes, such as managing inventory. It also allows you to view how your manufacturing plant is functioning in real time and can notify you about bottlenecks. This data can be collected from CRMs, ERPs, machines, sensors, and additional cameras installed in the facility.

Managing inventory
With real-time analytics, you can get an in-depth overview of what’s happening with your inventory in real time. This includes the sales potential, the cost of inventory, and the status of aging products. For instance, viewing a dashboard for aging products can ensure that you aren’t left with expired stock, so you can sell soon-to-be-expired items on a priority basis. You can use real-time analytics for inventory management in four ways:
- Descriptive analytics: It focuses on the “what,” i.e., what are your basic figures in inventory? These are numbers that are shown on dashboards. For instance, you can view a dashboard to check the cost per unit of the newly arrived items at the warehouse.
- Diagnostic analytics: Diagnostics analytics look for the root cause behind your reported data. For example, if you want to know why your organization experienced a Month-over-Month (MoM) growth, then diagnostic analytics can provide insights into the decisions that were the catalyst to it.
- Predictive analytics: Predictive analytics uses your real-time data to predict what the future has in store for you. For instance, real-time analytics can use the news of the outbreak of a new COVID-19 variant to warn you about the possible shortage of PPE equipment.
- Prescriptive analytics: Prescriptive analytics recommends the action that you need to take. For instance, it can tell you to fill 80% of orders for a client in a four-day time frame.
Use Striim to Power Your Real-Time Analytics Architecture
Regardless of which industry you operate in, you can use Striim to perform real-time analytics by using it as an intermediary between your source and target systems. Striim comes with plenty of convenient features. As a real-life example, take a brief look into how Striim transformed Ciena’s real-time analytics ecosystem.
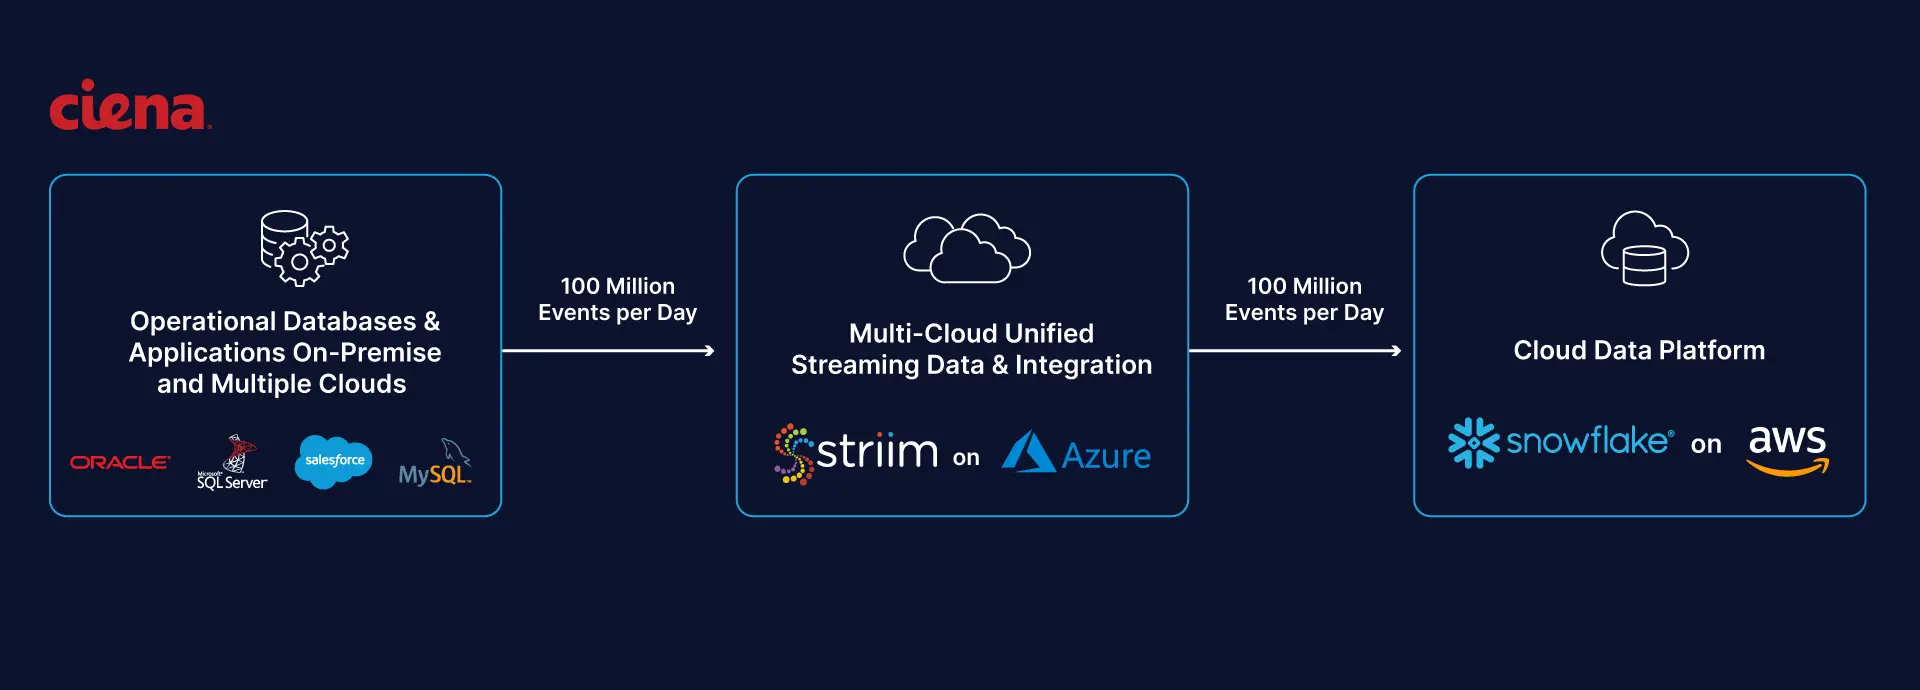
Ciena is a prominent telecommunications equipment supplier. Ciena was looking to create a modern real-time analytics ecosystem to improve the customer experience and make sharing of data access easier. Ciena used Snowflake as a data warehouse for operational reporting. They used Striim as a real-time data analytics tool to replicate changes from Ciena’s data sources — Oracle, SQL Server, MySQL, Salesforce — to Snowflake. Striim collected, filtered, aggregated, and updated this data in real time. This amounted to loading nearly 100 million events per day, enabling Ciena’s business functions (e.g., accounting, manufacturing) to perform advanced real-time analytics with better speed and ease than before.
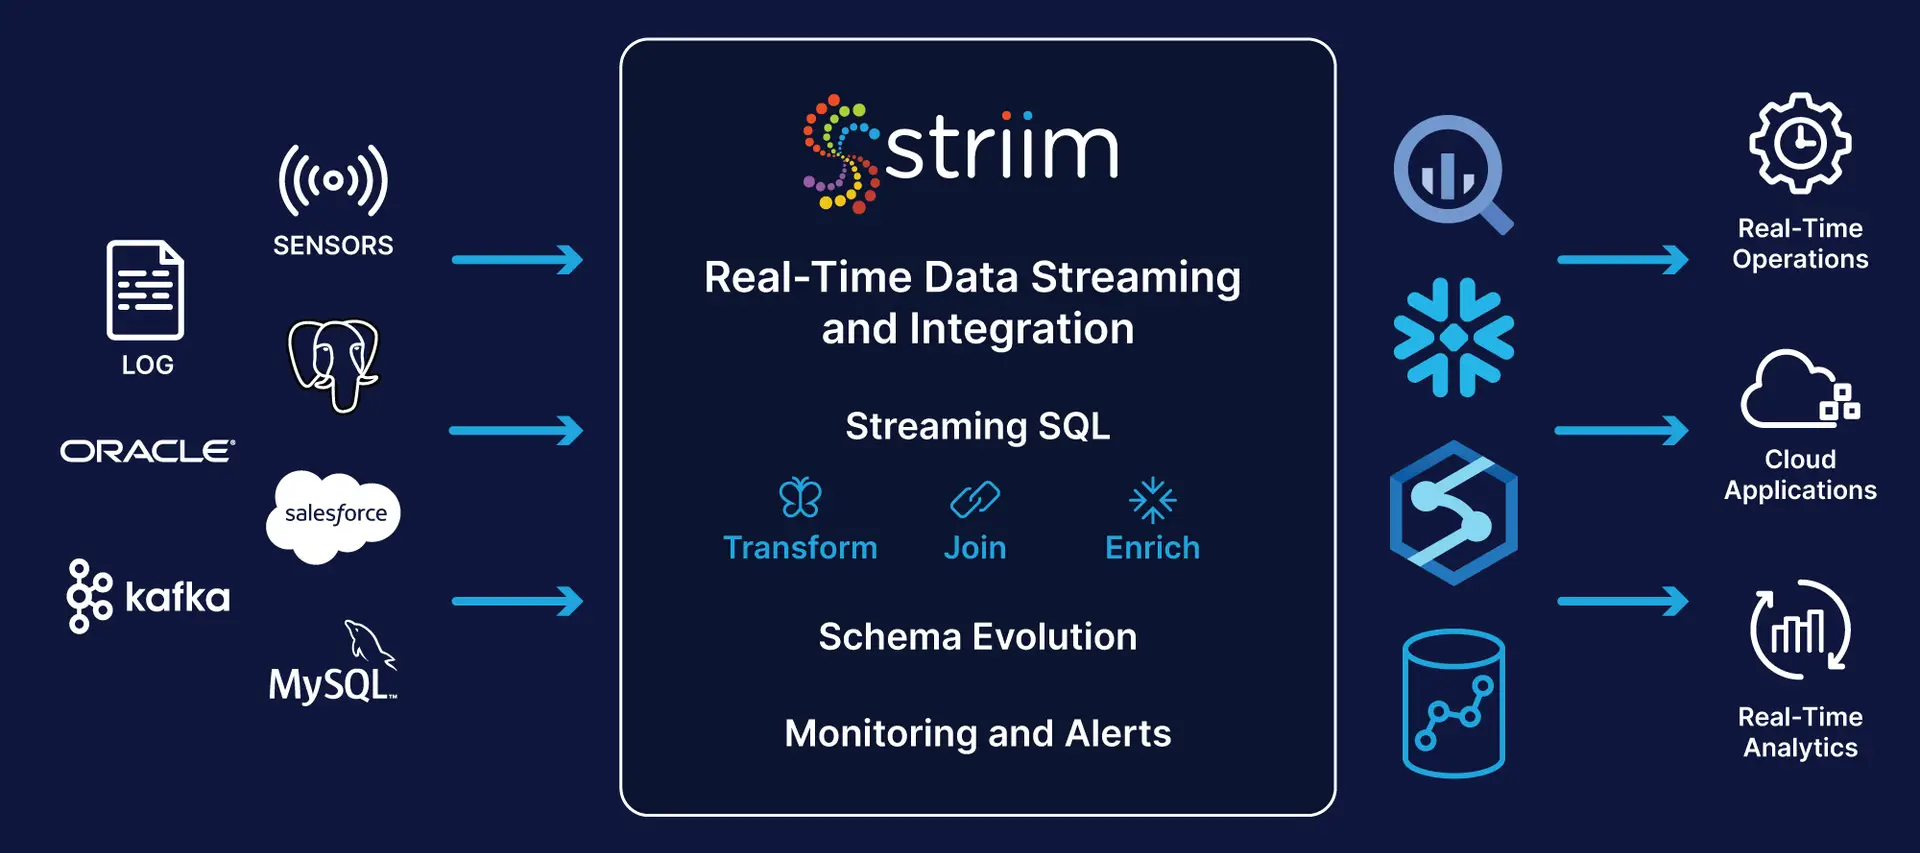
For starters, here’s what you can do with Striim.
- You can go through Striim’s large library of templates to find a wizard that allows you to connect and integrate your data sources. For instance, Striim can help you to move data from Oracle Database to Kafka, SQL Server CDC to Azure SQL DB, Oracle CDC to BigQuery, and many more.
- The wizard helps you create a data flow application. A data flow application allows you to define how you want to collect, process, and deliver data. This can be as simple as setting up a data source and a target system and moving data through them in real time through a stream.
- Your data flow applications can continuously ingest data, process it in real time, and deliver it to your targets with millisecond for real-time analytics and longer-range analyses including historical data.
- You can gain real-time, actionable insights from your streaming data pipelines through streaming analytics. Striim also lets you build dashboards to visualize your data flows in real time.
- You can configure built-in alerts in Striim for a wide range of metrics. In case of failures or errors, you can also set up automated workflows that trigger corrective actions.
To learn more about Striim, request a demo or free trial and see for yourself how Striim can be a useful addition to your real-time analytics architecture.