


In addition to having some of the best streaming technology out there, Striim also has a reputation for being extremely available and responsive to both customers and potential customers. In that vein, Striim’s founder and CTO, Steve Wilkes, makes himself available every Wednesday for a live weekly CTO Webinar.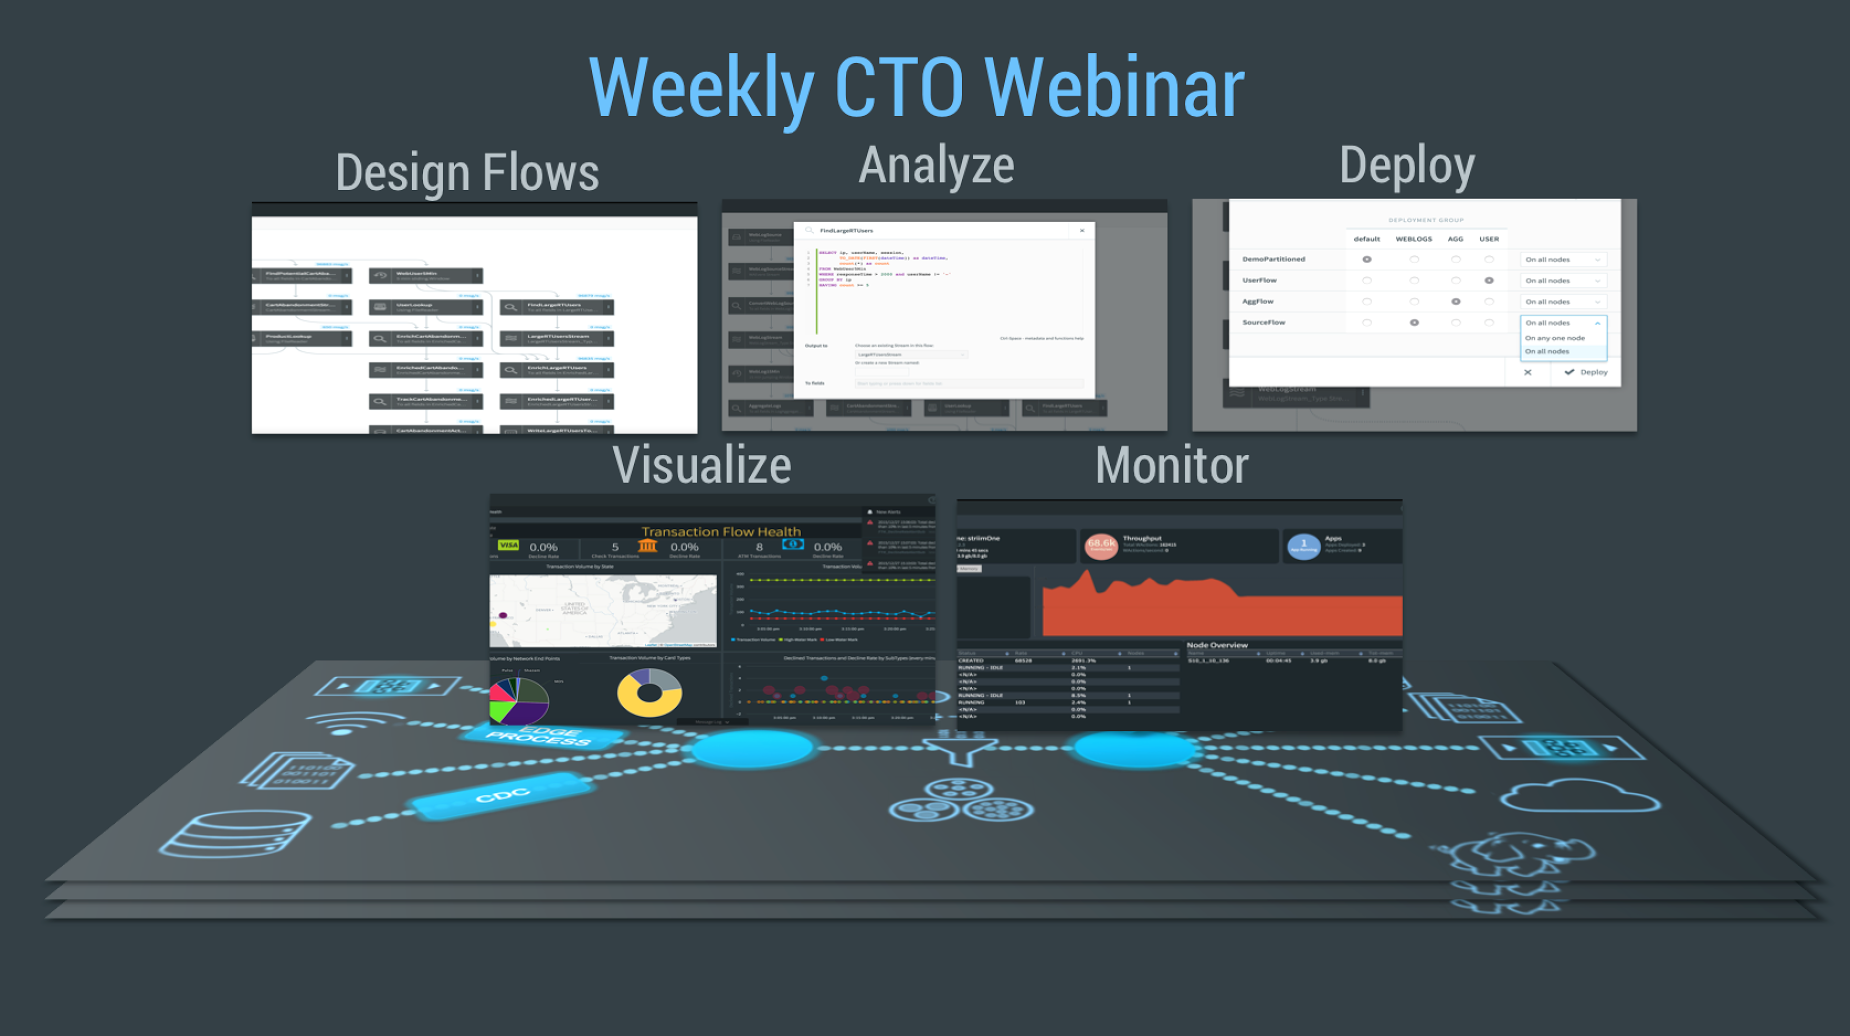
Here is a brief overview of what the weekly webinar covers, including a Live Demo of the Striim platform:
- Company overview, genesis, founding, funding
- Product purpose, industry uptake, common use cases
- What can one do with the platform
- Data collection, change data capture, sources, targets, data lakes, windows, aggregates
- Data processing, data enrichment, event patterns, data correlation
- Analyze results, predictive analytics, and visualization with dashboards
- Key differentiators
- Live demo
- Q&A with Steve Wilkes
From initial collection of data, processing, delivery, analysis, alerting, and visualizations, we invite you to speak 1:1 with Steve to learn more about how we can help you with your streaming architecture.
![]()
Complete video transcript of a 2016-04 CTO weekly webinar with time stamps:
0:00 good morning thank you all for joining I’m Steve Wilkes and I’m gonna take about half an hour of
0:04 your time to go to a brief overview of the Striim platform and a quick demo to
0:09 show you all the functionality
0:13 Striim was founded in 2012 while and the four of us founded the company we came
0:19 out of Golden Gate software and Golden Gate was or is still the number one
0:26 technology for moving data between databases transactional data using
0:31 Change Data Capture when we’re talking to customers at Golden Gate they were
0:35 pretty often asked us where you are good at moving data between databases can we
0:39 look at that data while it’s moving can we analyze it and those kind of the genesis
0:44 of the company when we set out to build an end and platform that could collect
0:49 high-speed streaming data process it, analyze it, deliver it somewhere else and then
0:57 visualize that data and alert off it those four years later on will fulfill that
1:02 mission and that is our vision we backed by leading investors like summit partners and
1:09 Intel Capital and very recently Atlantic Bridge came in and extended
1:16 series B round
1:19 the technology is a mature form, we are currently on version 3.2.4 of the
1:25 platform with more releases coming this year most of our customers in finance
1:32 telco retail gaming we have some customers are interested in is another
1:38 things it’s pretty varied and across the board
1:44 the Striim platform provides streaming integration and intelligence and this
1:50 enables you to do streaming analytics we emphasize streaming integration
1:55 because if they recognized that you cannot even start to analyze data that
2:00 you can’t get to the streaming integration is all about being able to
2:04 collect data in a high-speed fashion as that data is being produced and all of this
2:10 enables you to make it a useful as soon as it’s created
2:16 the goal of the product is to provide an end-to-end solution to make it easy for
2:23 people to do real-time data collection and streaming integration of high-speed
2:28 data and then to be able to build on that
2:31 be able to aggregate data correlate it analyze it than to you and visualize and
2:38 reports up it but be able to do all with enterprise-grade product that has built
2:45 in reliability scalability security all the things you expect from Enterprise
2:51 Products
2:56 so
2:58 a lot of different use cases that is thinking of when it comes to when it
3:03 comes to data you may be building and data Lake you may have requirements
3:08 provide data to external parties or internal customers as a service on
3:13 demand you might be looking at handling huge amounts of IOT data or monitoring your
3:20 infrastructure or equipment or even database replication in in in real
3:26 time
3:27 understand what’s really going on but you may have a mandate to improve
3:31 customer experience by understanding what your customers when they know it or
3:36 ensuring that you meet customer SLA’s looking for things like fraud or other
3:42 types of unusual behavior that can be damaging to your customer experience or
3:46 damaging to your company so we truly believe that whatever type of use cases
3:53 doing in the data space when you’re creating an overall enterprise data
3:58 strategy you need to sync streaming first and streaming integration has to
4:03 be part of your overall data strategy and overall data infrastructure is if
4:08 you doing things in a about fashion and you can’t move to real time later if you
4:14 do everything the streaming passion than your favorite position to start handing
4:19 some of these more real-time types of applications in the future
4:26 the platform as I mentioned is a full end-to-end platform
4:31 you think of it that we handle all the plumbing we handled the difficult parts on
4:37 parts of the application that you want to build so all of the enterprise grade stuff
4:41 stuff scalability the security the reliability that’s all handled by a
4:46 platform
4:48 in addition obviously we provide all the functionalities enables you to collect
4:54 data as it’s being produced in a streaming fashion to process that data
4:58 in a whole variety of different ways to deliver it to other systems to
5:03 manipulate that data and to enrich it with context to visualize it up and to
5:10 do all of that through a very simple declarative interface through a UI drag
5:16 and drop UI and enable you to define all of the processing within your data
5:22 the pipelines as he who like language is SQL like language that you could have
5:29 special difficulty we found that most developers with the Java or Python as C+
5:37 shopped whatever they also understand sequel as the business analysts and as
5:42 we take the scientists so SQL is kind of the common language that enables
5:47 people to understand the process to build their processing quickly
5:52 the simplest thing that you can do with our platform is moved at high speeds
5:57 from one place to another so that starts with collecting data collecting it in in
6:03 real time as it’s been produced and turning into data streams to some things
6:08 are obviously streaming if you think about message queues JMS Kafka or
6:14 flume they do continuous push production of data that naturally streaming if you
6:22 think of things like log files if you’re moving log files in batches wait for files
6:28 we finish the ship it that’s not streaming and depending on the
6:32 granularity of the file is now is an hour behind so
6:38 for things like log files you need to have parallel collection of data as is
6:43 being which is you need to reader it that way to the end of the log in as new data
6:47 is being written you start streaming that through it seems like databases not
6:51 many people think of those are streaming at all
6:54 but in reality the only real way getting data from Enterprise ltp systems in a
7:02 reasonable time frame is to use a streaming technology exchange data
7:06 capture which looks at all of the activities happening the database will
7:11 all of the inserts updates delays happen in a database and to capture those from
7:16 the transaction as the recovery and turned into a change stream so then
7:22 change stream can then be turned in real time as a real-time view of what’s
7:28 happening in the database and in reality CVC is the only way to get
7:33 this type of data from production databases most DBA’s won’t allow you to
7:37 example to run large full table scans your queries against the whole table on
7:43 a production database they’ll say to create a read only instance or an
7:49 operational data store some other way of getting data from that database and typically that
7:54 mechanism of creating that reason instance or appreciate this story uses
7:58 changed so we have built-in Change Data Capture for Oracle for MSQL for MySQL
8:06 and for the HP non Stop sytems you get all of that change has changed
8:13 when you think about sensors, they can deliver data in a whole variety of
8:18 different ways through various ports a TCP UDP HTTP and various protocols I kemp
8:23 et and
8:26 the real goal is to enable some degree edge processing in not necessarily
8:31 wanting to collect all the data from sensors you want to be able to do some
8:35 processing on the edge to reduce the amount of data that you’re sending her
8:39 into your core data center and you may want to reduce redundancy and you may
8:45 want to also look for a particular patterns at the edge where things are
8:49 happening let’s be able to work on very quickly
8:53 so independent of whatever you’re collecting whatever you what you end up
8:57 with a data streams and these data streams can then using a platform be
9:03 delivered into other things they can be delivered in Hadoop, NoSQL technologies,
9:08 can be delivered into the cloud into message queues like Kafka again
9:13 JMS and into databases data warehouses and that happens from collection of
9:21 the data through to delivery at the data typically in milliseconds
9:27 but for most customers they need to do additional work we do have some
9:32 customers just doing Change Data Capture from Oracle for example and delivering
9:38 that into Kafka or pushing into Hadoop and doing all of that in milliseconds
9:43 Christmas within typically build some additional monitoring such fabrications
9:47 maybe some undertaking and threshold on that simple data flow that’s the core of
9:54 the use cases to move data in real-time to ensure that their data lakes
9:58 up-to-date or the people getting up to date information on Kafka
10:02 but typically you need to do additional work additional processing on that later
10:07 so as a number of different types of basic operations you do on this
10:10 streaming data and in our platform for all of this is done through continuous in
10:15 memory queries so the data flows through queries you’ve defined and
10:21 continually producing results there’s no notion of jobs or batches or anything like
10:25 that it’s all just happening continually so with continuous queries written a
10:30 sequel like language you can do filtering you can do
10:35 data transformation if you wanna do aggregation you need to add in construct
10:41 called a window and they see turns the unlimited unbounded stream into a
10:47 manageable set may be the last five minutes worth of data or the last
10:52 hundred records or a combination of both
10:54 that allows you to do things like calculate aggregate over that moving
10:58 window like ways the last five minute moving average for each of these values and
11:04 then to compare those values do statistical analysis or just create aggregates and
11:08 then store them somewhere rather than storing the raw data
11:12 that’s really where windows come in you need those to know to create useful aggregates
11:17 the final thing you do is to enrich it and I was like
11:22 virtually every one of our customers is doing some degree of enrichment of the
11:27 original data and think about it this way that the source data may not have
11:32 all of the context necessary it’ll just make decisions either within a platform
11:38 or if you land that data into NoSQL or into Kafka or into Hadoop, you have to
11:46 ask the question is the data that I delivered there gonna have enough context to
11:50 notify me to ask questions of its run queries and if the answer is No
11:55 which it typically is then you probably gonna have to do some enrichment of that
12:00 data
12:02 and so example of that would be that we have a customer collecting call
12:07 detail records in the telco space these call detail records have a
12:12 subscriber identifyer in them on the raw call detail records you can look at the
12:18 overall network and see what’s happening you can set thresholds and alerts has
12:23 more than a certain number of dropped calls for example a certain location you
12:28 can deal with it but this customer wants to be able to look at the network from a
12:34 customer perspective each customer has their own set of expectations of the network
12:40 that different plans they may be paying for and different SLA’s for reliability number
12:47 of dropped calls network speed etcetera
12:50 by looking at the basic network you can’t see that but if you in real time
12:56 join those raw data records with customer information
13:02 so enrich the data as it is flowing through now you start to look at the network
13:07 from a customer perspective and so does typically where enrichment comes in is to
13:12 add additional context data is maybe to enrich with the results of some modelling you’ve done
13:20 European customers propensity to do things in order to help you make
13:24 predictions and all of this enrichment happens in real time very high speed we
13:30 particularly architectured the platform as it scales to manage the enrichment process
13:38 in a really efficient way but by bringing
13:41 events are being processed to the data which is the only real way of enabling
13:46 this high throughput while doing the enrichment
13:51 once you have a streaming integration in place when she collecting data and
13:55 you’re essentially delivering some routes or processing it then you start
14:01 to think about doing things like more intelligence start to look for patterns
14:06 of events over time for example which is something from their complex event
14:11 processing world were you looking for sequences of events over 1 or more source
14:16 within certain time frames that may indicate something interesting and you
14:22 can also look for outliers things it looks like that anomalies or something
14:26 unusual and you can do correlation of data where you’re matching data from one
14:32 stream with another stream or matching it with some external
14:36 context and we do have a customer for example there is correlating across
14:44 multiple different types of log files that they have because each log file
14:50 may contain certain occurrences of problem but it’s when those problems
14:57 occur at the same time or within a set time frame they really big issue and so
15:02 can you really do that but mostly correlation in real-time systems
15:08 actually happening because it’s really hard to after the fact with moving
15:12 time windows across multiple files
15:17 when you have the results of any of this processing you can write it as any
15:22 of the external systems of the support but you can also store it in a little
15:27 store so we have our own internal result store by default it’s backed by
15:32 elasticsearch it scales as well our platform scales over a custom everything
15:37 he goes in there is pre index which means results come back really quickly and
15:42 then you can further analyze these results you need to feed those results back into
15:46 further processing and use those results for things like predictive analytics
15:52 on top of all of that we do have the ability to build dashboards and in
15:56 real-time visualizations of data which enable you to see what’s happening in
16:02 real time and everything from initial collection of data processing delivery
16:07 analysis alerting and visualizations all streaming so everything is being pushed
16:14 all the way through to the dashboards in real time
16:20 so stream has been designed not require any additional software JVM Java Virtual
16:29 Machine so it runs on commodity hardware sales really well as part of a cluster
16:34 but it has been designed to integrate really well with other things that you
16:40 may have in your infrastructure so while it doesn’t require Hadoop to run it integrates
16:45 really well with it it doesn’t require an external Kafka system to run that integrates
16:51 really well Kafka and Flume and some of the other technologies you may have
16:55 Striim really plays this part for real-time applications and a real-time
17:00 view into what’s happening real-time analysis is working really well with
17:05 maybe a big data and long-term analytics applications or even your legacy
17:09 applications may be running on a ODS or enterprise data warehouse
17:14 and it’s a two-way conversation we can deliver things into these places in too
17:19 deep into the ODS we can also use the information in Hadoop or ODS for
17:24 context which we can use to enrich and enhance the whole real-time
17:28 applications
17:31 the things that really makes this different that we are an end-to-end
17:35 platform enables this real-time streaming integration on which you
17:41 can then build analytics and we have this non-intrusive capability of
17:47 capturing relational change using Change Data Capture as I mentioned for Oracle
17:54 MySQL, MS SQL, and HP NonStop systems that’s unusual in the
18:00 streaming space to be able to do this
18:02 Change Data Capture is something that we do really really well so if all you want
18:06 to do is ingest data from the database in real time into Hadeoop or Kafka, you
18:12 can use our platform for that and if you do use our platform for that then you are well
18:16 set up to start thinking about maybe doing streaming analytics and
18:21 looking for issues and thresholds and other types of interesting patterns in
18:28 real time later
18:31 you want to do things like multi-stream correlation or enrichment of streaming data
18:35 there is context in our platform to do this really well
18:39 the other key thing that we provide these all of the processing in our platform is done for
18:46 this sequel like language so you don’t need to have Java developers or other
18:51 types of coders to enable you to build that is applications that means you
18:56 could rapidly build applications that solve your business problems without
19:01 having to do any coding you just install our platform with built-in applications and the
19:07 platform takes care of the rest for you
19:09 and having the built-in visualizations as well and really enhances the
19:16 experience and the ability to build for end-to-end applications and of course it
19:21 goes without saying that if you’re looking for a platform that can do all
19:24 of these things you need something that is enterprise strength and enterprise scale and
19:29 for a secure and overage the low-cost computing you may have whether its
19:34 actual service or virtual machines or cloud hosting solutions
<< PRODUCT DEMO >>
19:40 so with that, I’ll go into a brief demo of the product
19:48 the platform works utilizing these applications which are data flows and the
19:54 data flows are doing all the back-end processing of the raw data if we look at
19:59 a simple application
20:02 you see it’s like a directed graph flow of data from the top to the bottom
20:09 you can build these applications using the UI so you can drag and drop
20:15 for example the datasource into the UI configure it, say reading from files how
20:20 you want to parse the data with Apache Axis likes of the web blogs save this and the
20:26 editor component it
20:30 If you don’t like using UIs or you find it faster to build things using text
20:37 we do have a full scripting language
20:42 that enables you to build applications is just by writing a script and this
20:48 looks like a combination of DDL and SQL this is the exact representation
20:52 of this data flow you see here it’s a two-way street you can build applications in the
20:58 UI save it as text modifies it load it back into the UI the text files also very
21:04 useful for source control and for moving from dev to test our products etc
21:12 so if you look at this data flow you can see we started with the source and we have
21:17 some queries and intermediaries of the data streams so we look at a simple
21:21 query
21:23 this is a query that’s going to be running for every record read from
21:27 the data source the source of this case are some web blogs the web logs
21:31 represent every action happening on a website for a company that sells wearable
21:39 products
21:40 so each log entry is something that a user has done and you can see here we
21:46 capture the IP address we doing all this manipulation of the incoming data to put
21:52 into right data types or do some date parsing or looking for regular expressions in the
21:57 incoming data under certain circumstances we may have
22:02 a product ID in the URL people have clicked on people in searching things
22:08 etc and so all of this data is being read from the source and then it’s going
22:15 into a data stream
22:16 this is a prepared data stream it now has field names to make it easier to
22:21 query if I was a customer application typically what we seeing customers they
22:29 will build these data streams and do some initial preparation maybe even some
22:33 initial joins with additional context of the incoming raw data and then that
22:38 stream can then be repurposed in a number of different applications to
22:43 start off with a stream for a particular use case then find the data stream has
22:48 other uses
22:49 maybe by joining that stream with other streams you get even more valuable
22:52 information
22:54 this application which doing three different things with the same data stream this
22:57 tree we are doing some aggregation on that so it’s taking the raw stream
23:04 and chunking it into fifteen minutes and then we’re calculating some
23:10 aggregates on that so I can send average and grouping it by a number of different
23:14 dimensions and those dimensions will allow us to slice and dice if they don’t
23:20 buy those dimensions later on
23:26 but that raw data may not be enough so as these aggregates are coming through
23:30 we are utilizing in memory grid that we’ve loaded product information
23:36 into and we enable you to enrich the data as it’s flowing through with this
23:45 additional data and what does that look like in SQL, it’s to join so you just do simple
23:51 join everything from the stream everything from the look up where the
23:54 product keys match
23:57 and so now the data of the you have going through is the aggregate so we
24:02 produced before and it has these additional information from the lookup
24:08 also added to stream
24:11 and all of that is just being stored in internal results stores
24:16 the other processing that we doing in here for example we doing a check on
24:23 users so we’re looking at users on a moving basis within any five-minute period of
24:30 any users that have a response time for website ahead on that page takes to come
24:35 back more than two seconds more than five times
24:41 and if we find those people then we will not just take that fact that we’ve seen
24:48 that user will take everything they were doing in the window at that time and
24:52 join it with information that we’ve loaded in context information for the
24:56 user and information about the product and all of that is being written to a
25:00 file
25:02 the final thing that we doing here is we’re looking for people that may
25:06 potentially abandon the shopping cart and this is where we’re utilizing some
25:11 complex event processing type of functionality so we’re looking for a
25:14 sequence of events over time where the user is first browsing or searching for
25:21 things on the web site
25:22 results please log entries then they add things to a shopping cart they do all of
25:28 that three times and then they go back to browsing and looking at things if
25:34 they do that then we would have liked them someone that might potentially
25:36 abandon the shopping cart and again in a case where in enriching them with user
25:41 information and writing into a store
25:45 so that’s a basic application built using a product if I want to run this
25:51 first thing you need to do is deploy it when you deploy it is very flexible you can
25:55 deploy on one node, you can deploy everywhere in a cluster you can deploy bits of the
26:01 application on different parts of the cluster and that’s very useful if you
26:06 have certain
26:07 pieces of the cluster use for sourcing data others we wanted to processing of
26:12 his way on the store they they’re etcetera
26:15 when I deploy the application all of this definition that you seen here
26:19 becomes runtime objects if I now start this up is gonna start processing the data
26:27 so as the data flowing through you can take a look at this is the day the
26:31 following the rotating coming into this initial stream and we should look at the
26:36 data along as well so I can say I want to see what’s going on with the user’s
26:41 down here so I can preview this that this doesn’t happen that often but when
26:45 it does
26:46 you can see I have all of the information so this is a really good way of debugging your application
26:51 as you are going along and analyzing and looking actually what’s happening
26:57 so when you have this running application you something about building dashboards
27:01 so that’s what we built this application so we can take a look at
27:05 this
27:09 and this dashboard is built using the dashboard builder so
27:15 you can drag and drop any of these visualizations into the dashboard
27:19 for example I want a new pipe chart all of the visualizations are powered by a query
27:25 against the back end and so I’m gonna take an existing query
27:31 and the unique thing about this query here is this syntax which basically means
27:35 when you execute query go back fifteen minutes and then
27:41 get all the data from then till now and as you get new live data continue to push
27:46 it to the front end in real time that’s defined the query for the visualization
27:52 now you set up as a visualization uses the values from the queries and going to
27:57 use
28:00 a pie chart of hits that we have a number of times the page was hit by page
28:08 safe and we now have a new visualization on our dashboard
28:13 very simple dashboard that we’ve built for these demonstration purposes
28:19 there are more complex dashboards that we have built for customers
28:26 so I go back to my applications page
28:30 I will stop this application from running
28:36 deploy it and we have another application over here we built this and more
28:42 full-featured application is doing a lot more types of calculations and this is
28:48 actually monitoring financial transactions that may be occuring through a variety
28:53 of different sales points ATMs when it sells checks etc
29:01 if we take a look at the
29:02 dashboard for that one
29:05 you see it’s much richer, much more fully featured and this is not only monitoring
29:11 the types of transactions happening it’s actually in real time looking at the
29:16 number of declined transactions and any change in the decline rate that is too
29:23 dramatic will be flagged as an alert
29:28 and this application does allow you to drill down so I can drill down into a
29:34 particular location I can drill down overall what’s happening with the
29:40 transactions which he had them through are they debit transactions or ATM or credit
29:47 I can drill down by an individual state
29:56 and a variety of other ways of slicing and dicing the data
30:04 so thank you for attending
30:06 today hope you have really understood more about our products and
30:15 right now open for any questions you may have