


Step 1: Sign up
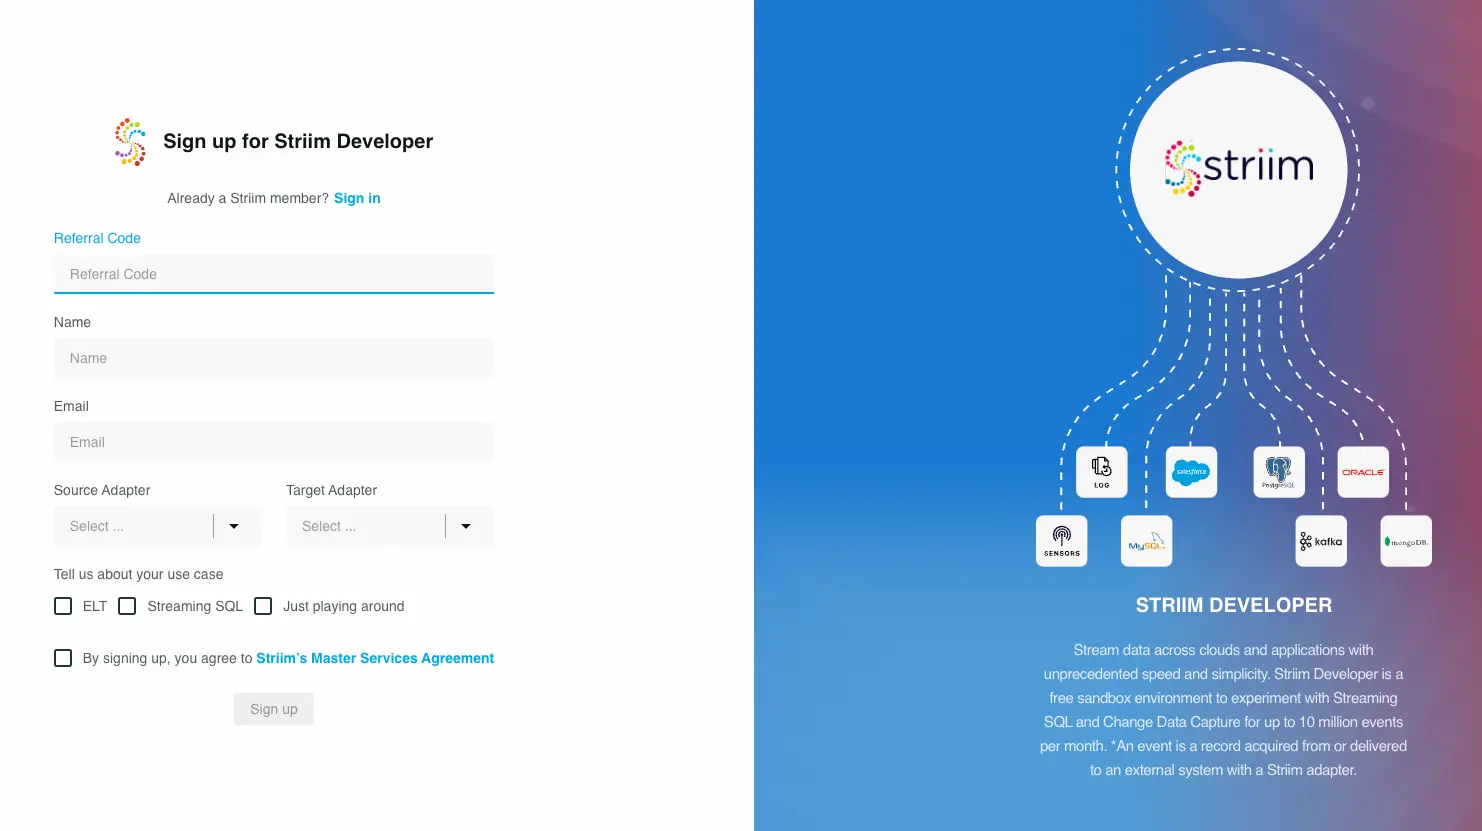
To sign up for free Striim Developer, you can use either your personal or work email address. Go to https://signup-developer.striim.com/ and use your referral code. If you cannot reach this page, try disabling any ad/cookie blockers or sign up from an incognito page. Fill in all your details and select your choice of source and target from the dropdown list.
Step 2: Create your account and complete signup
After you submit the form in Step 1, check your inbox. You would receive an email from Striim Developer with the next steps. Check your spam folder if you do not get the following email.
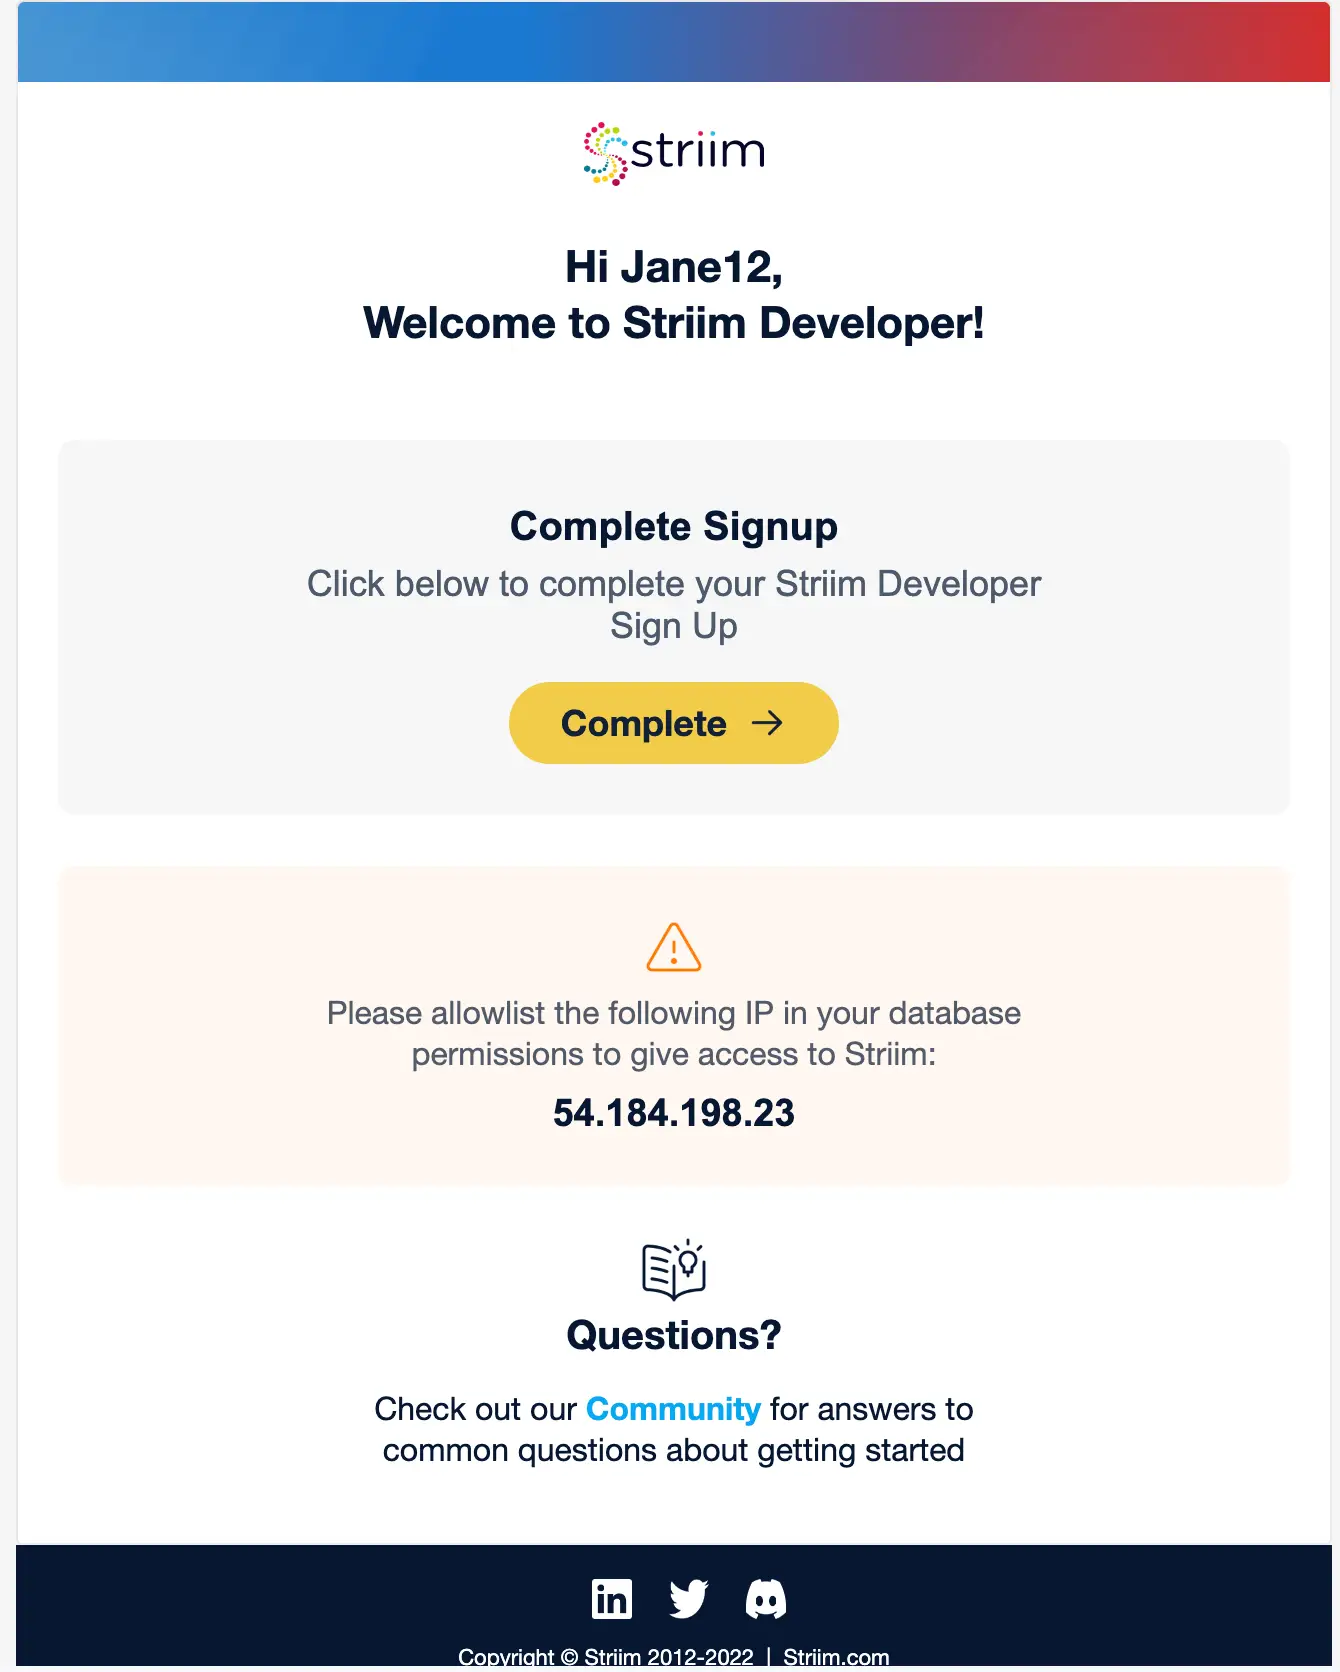
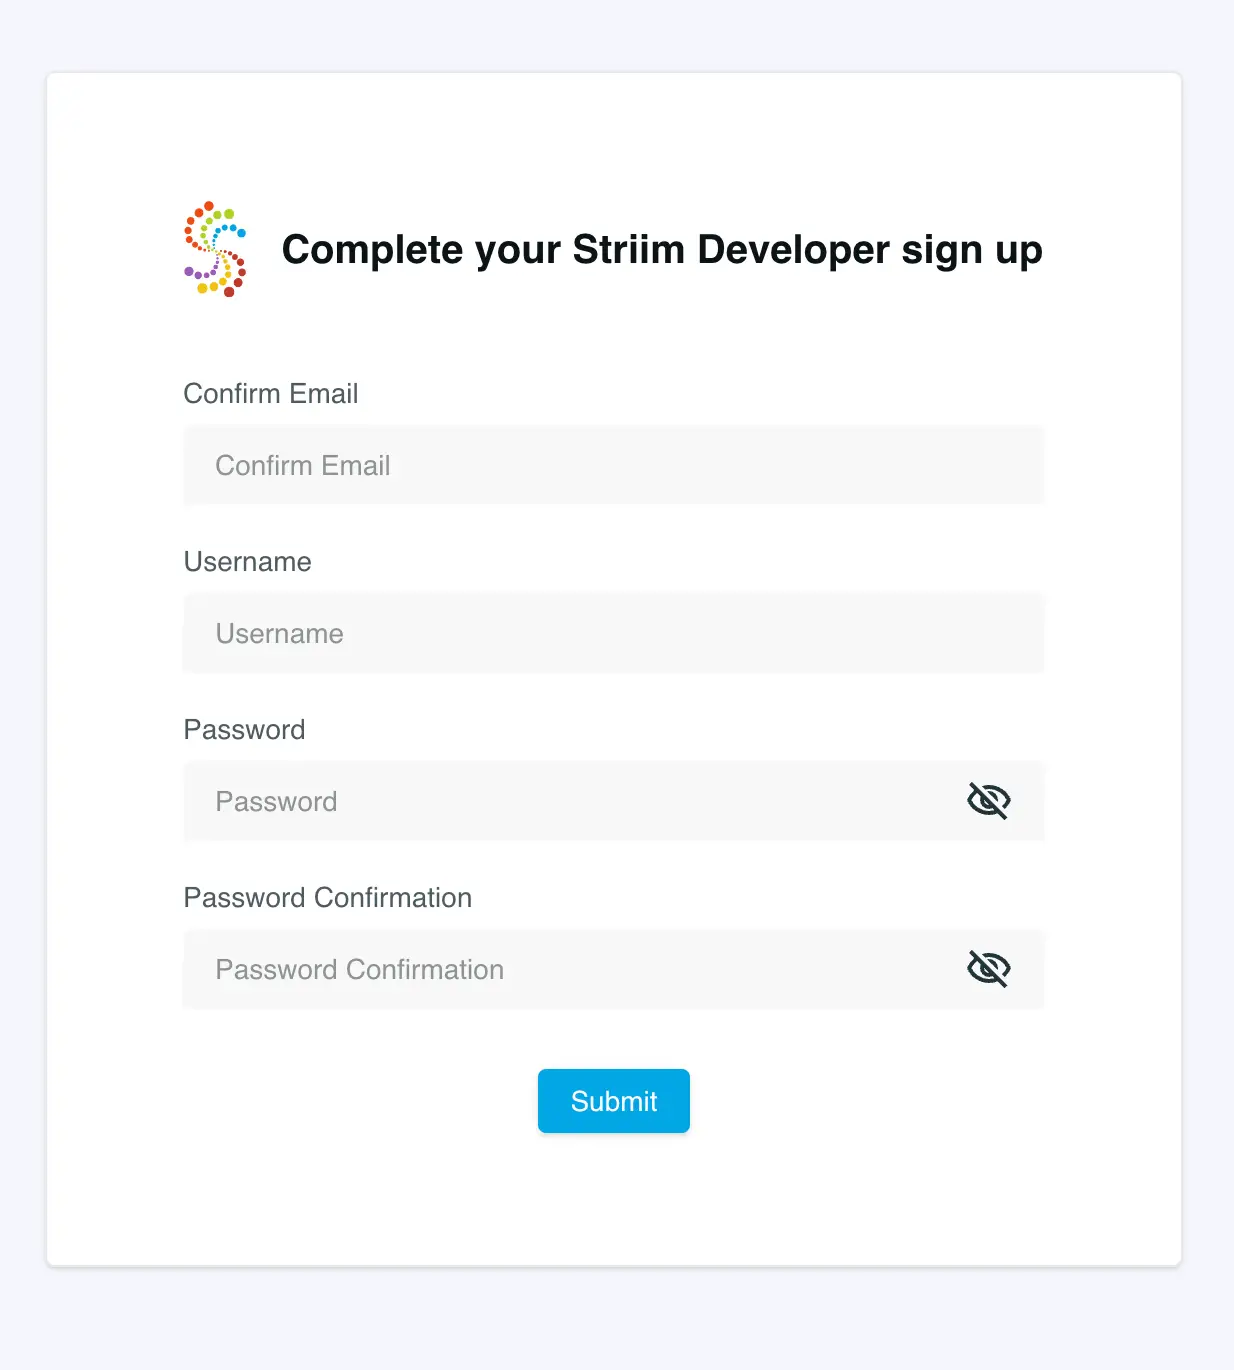
Complete your signup by clicking ‘Complete’. That will prompt you to confirm your email address and set your username and password. You can ignore the part about whitelisting the IP address.
Step 3: Sign in using your username and password
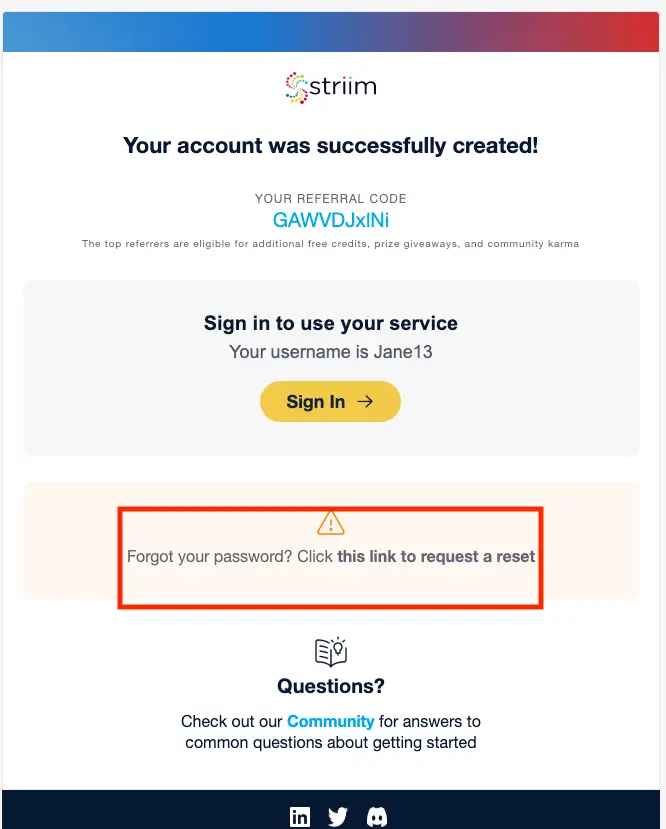
Once you submit the form from Step 2, you will be redirected to developer.striim.com sign in page where you can enter your username and password. You will also receive a confirmation email that contains the reset password in case you forget your password.
Create your first real-time analytics app
Step 1: Create and name your Striim App
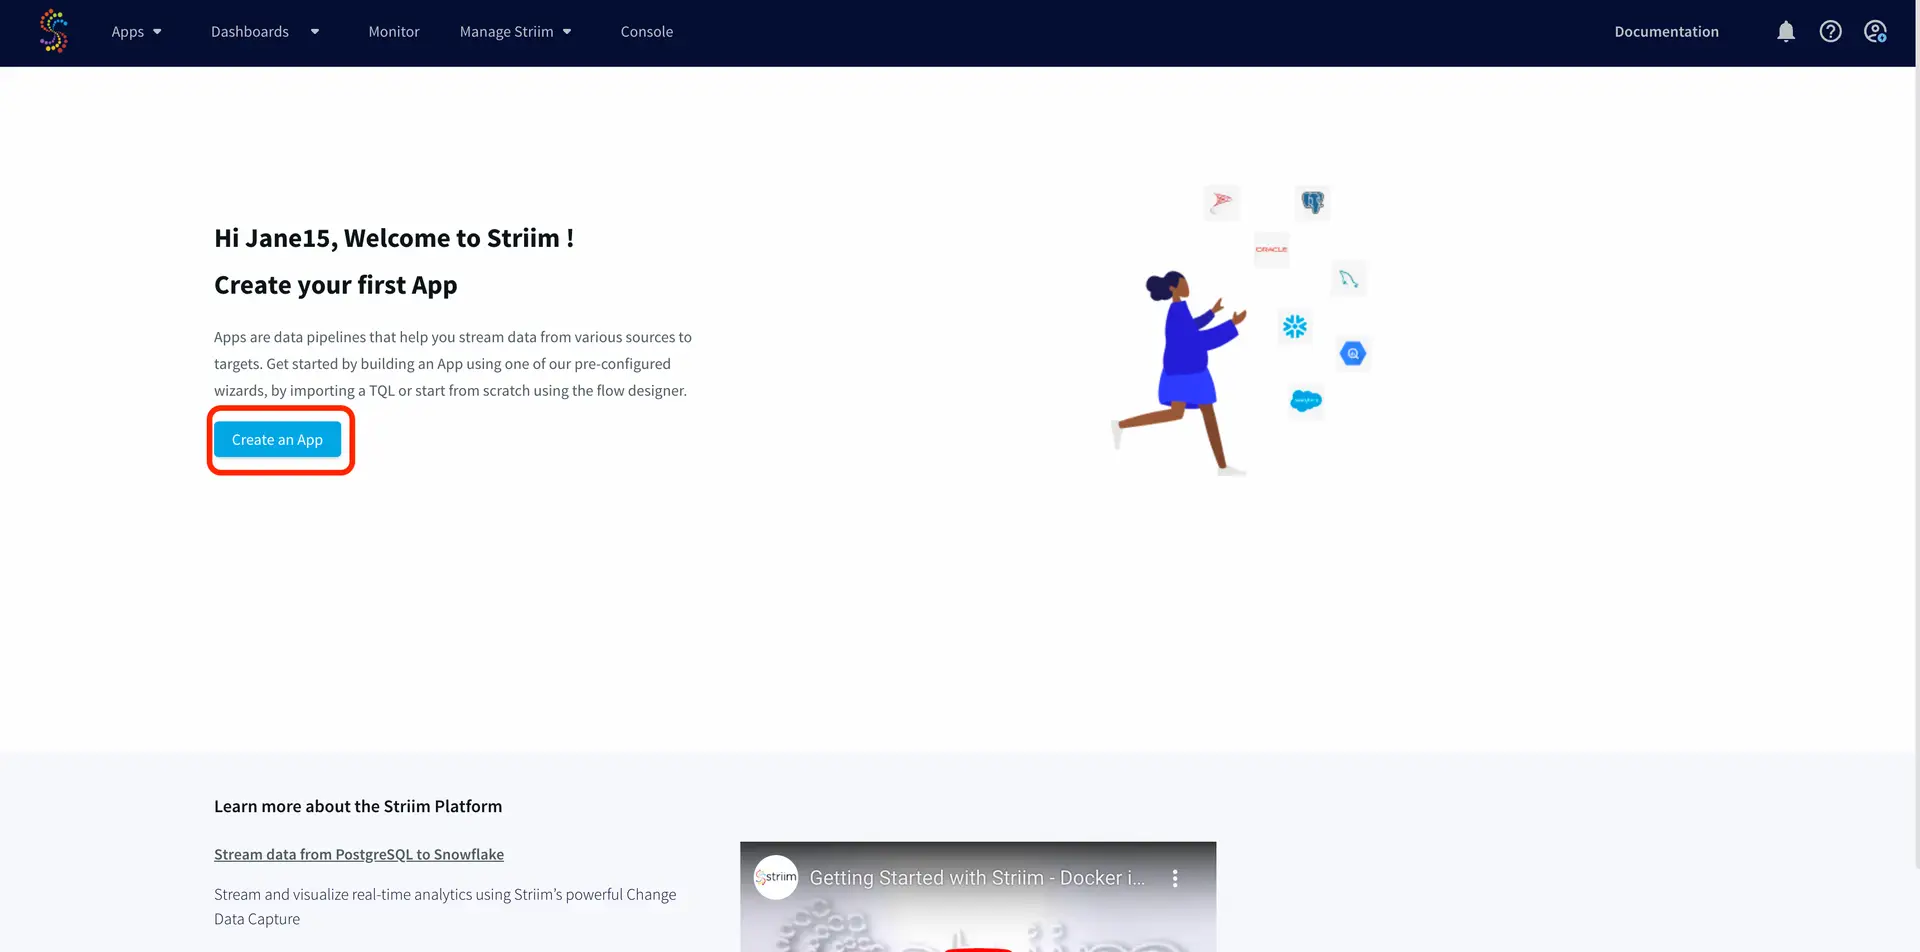
After you have signed into your developer account, click on ‘Create an App’ on the landing page.
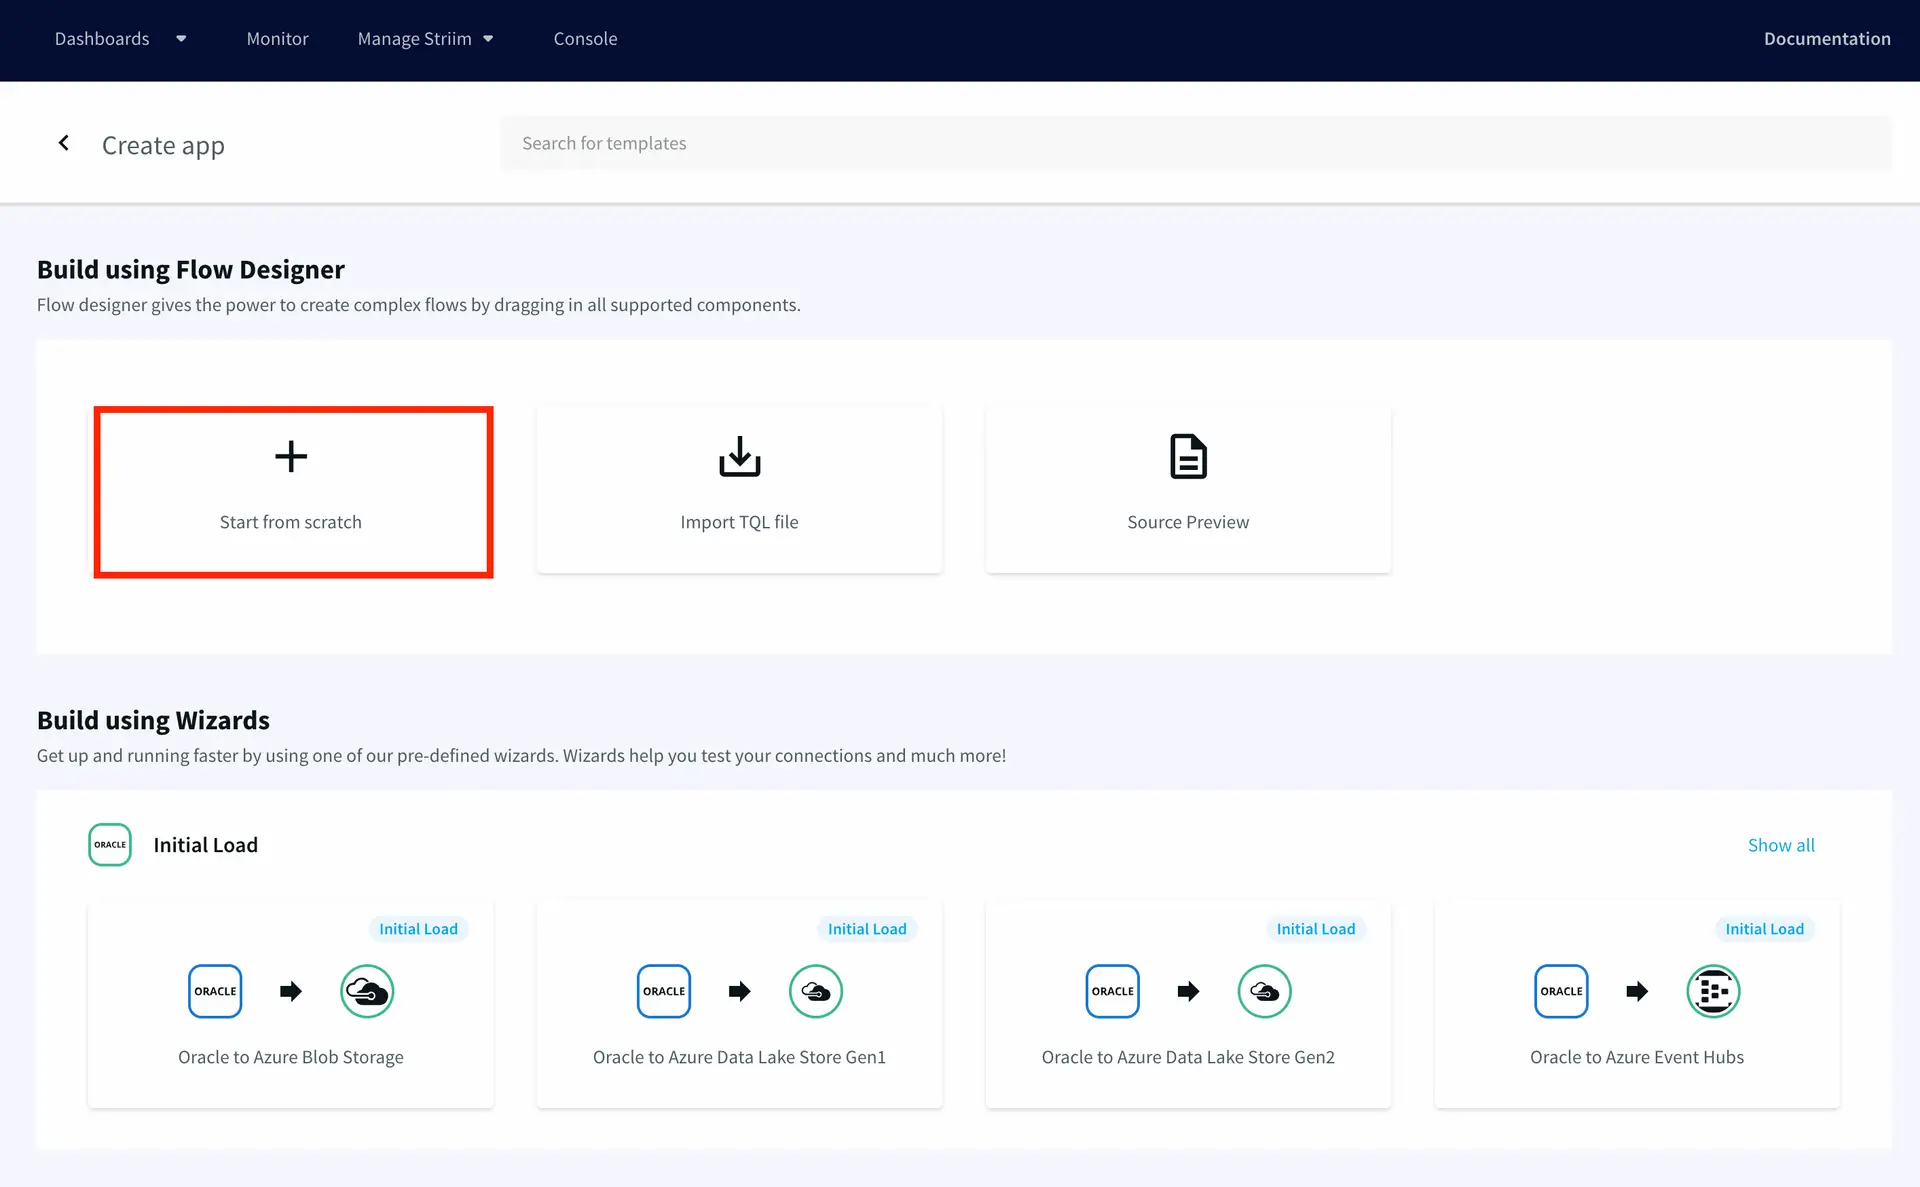
Build your app using flow designer by selecting ‘Start from scratch’.
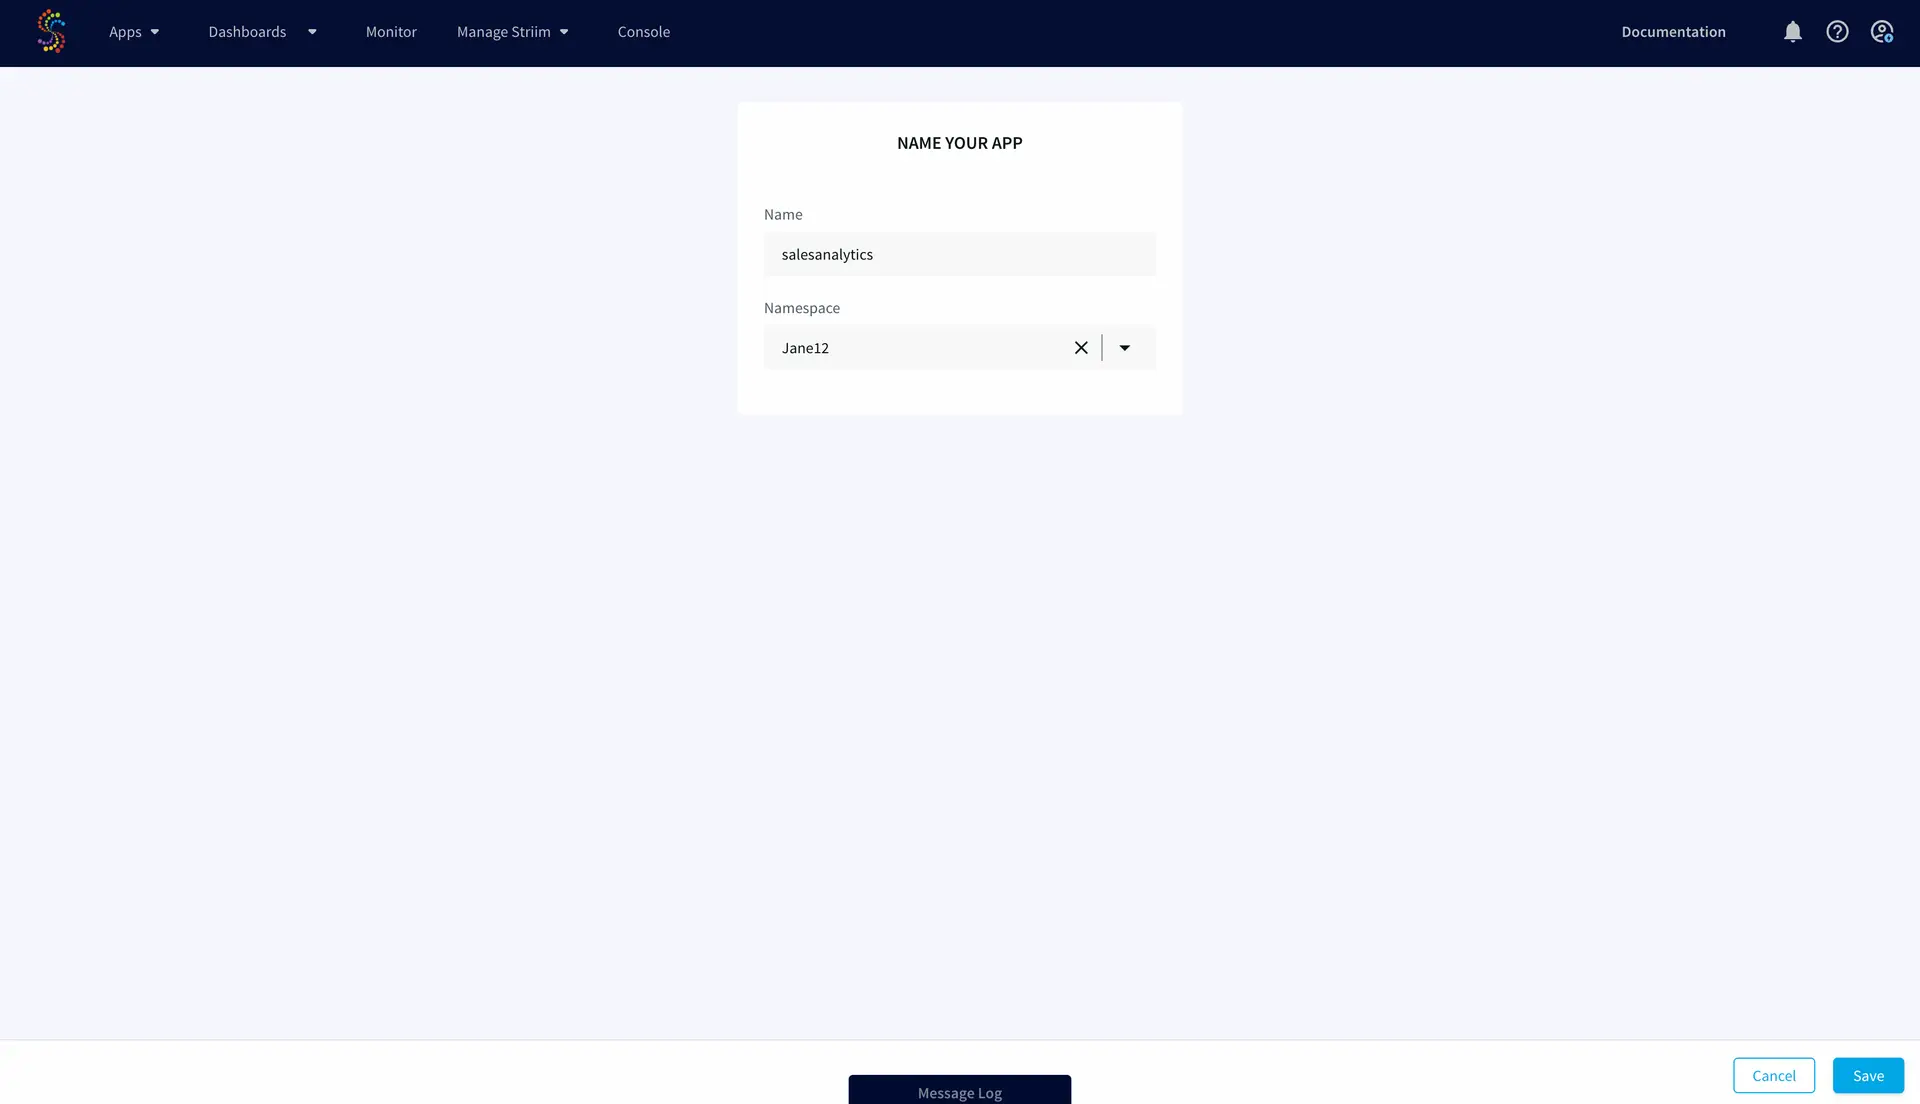
Next, name your app ‘salesanalytics’ and click ‘save’ on the lower right. Select the namespace that’s automatically set.
Step 2: Build a streaming application
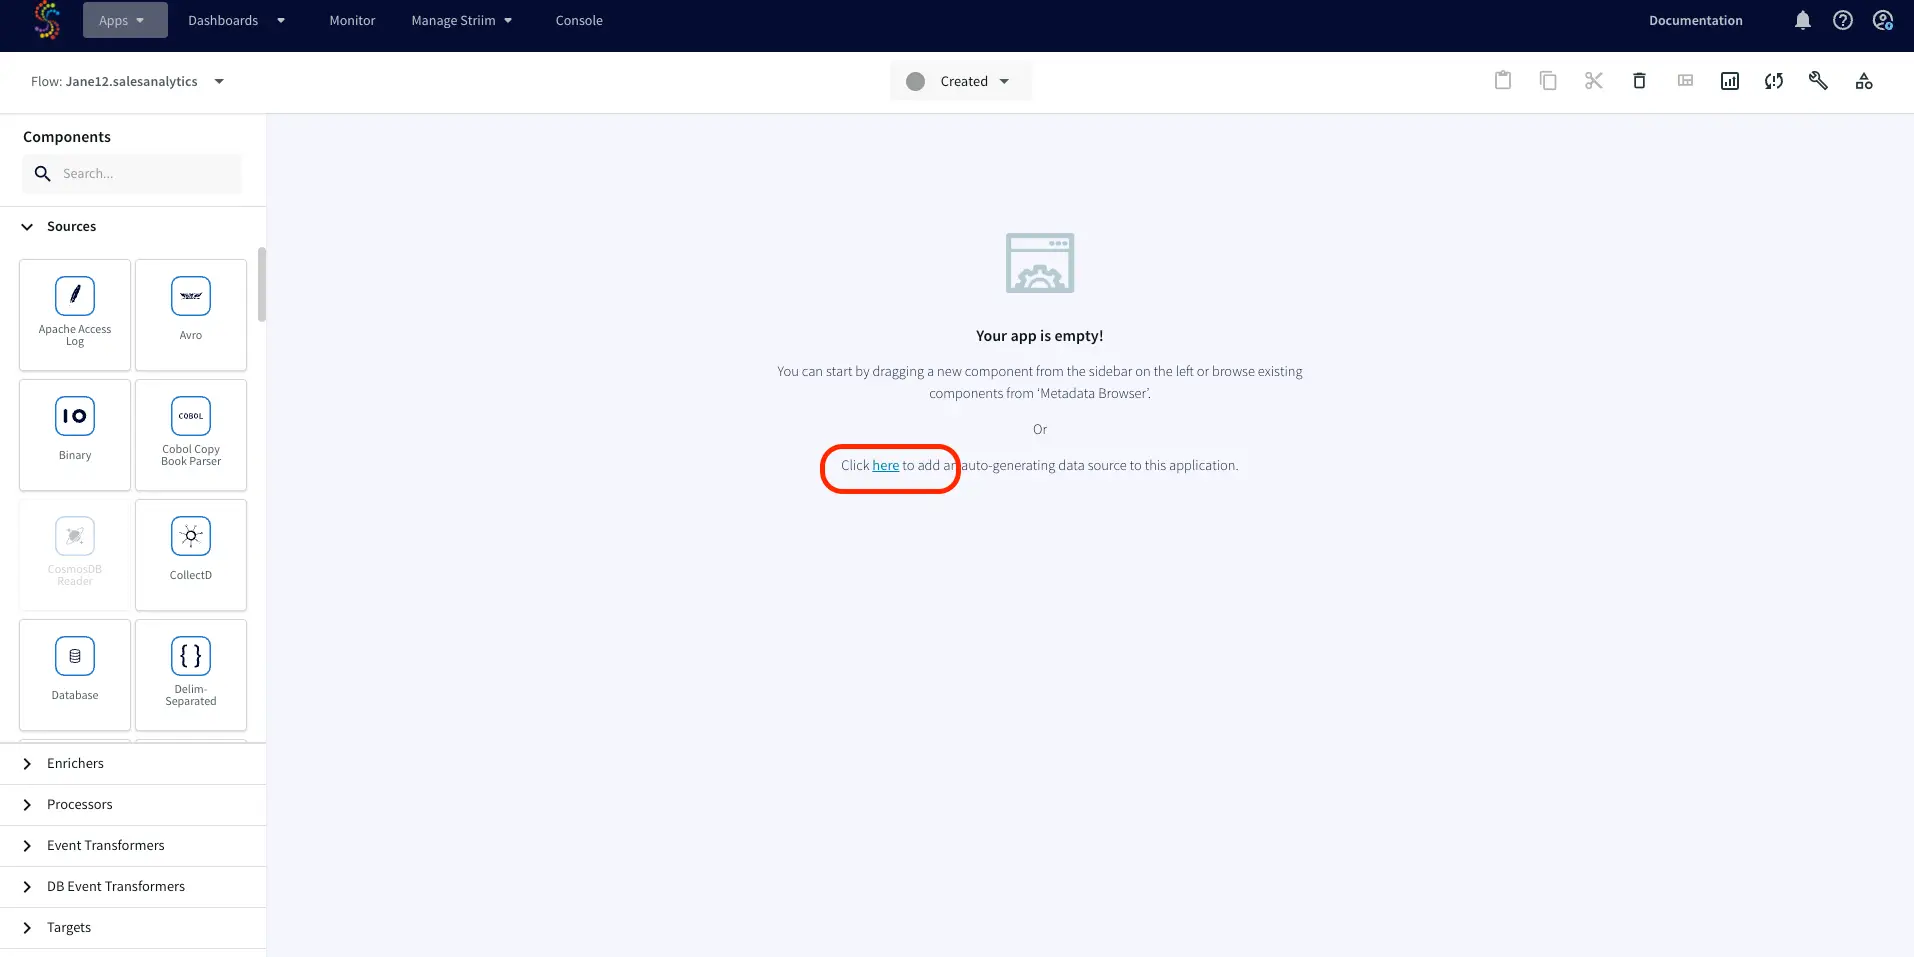
Now you are ready to build your first real-time analytics application on Striim. To add an auto-generating data source, click on the relevant link on your screen as shown below:
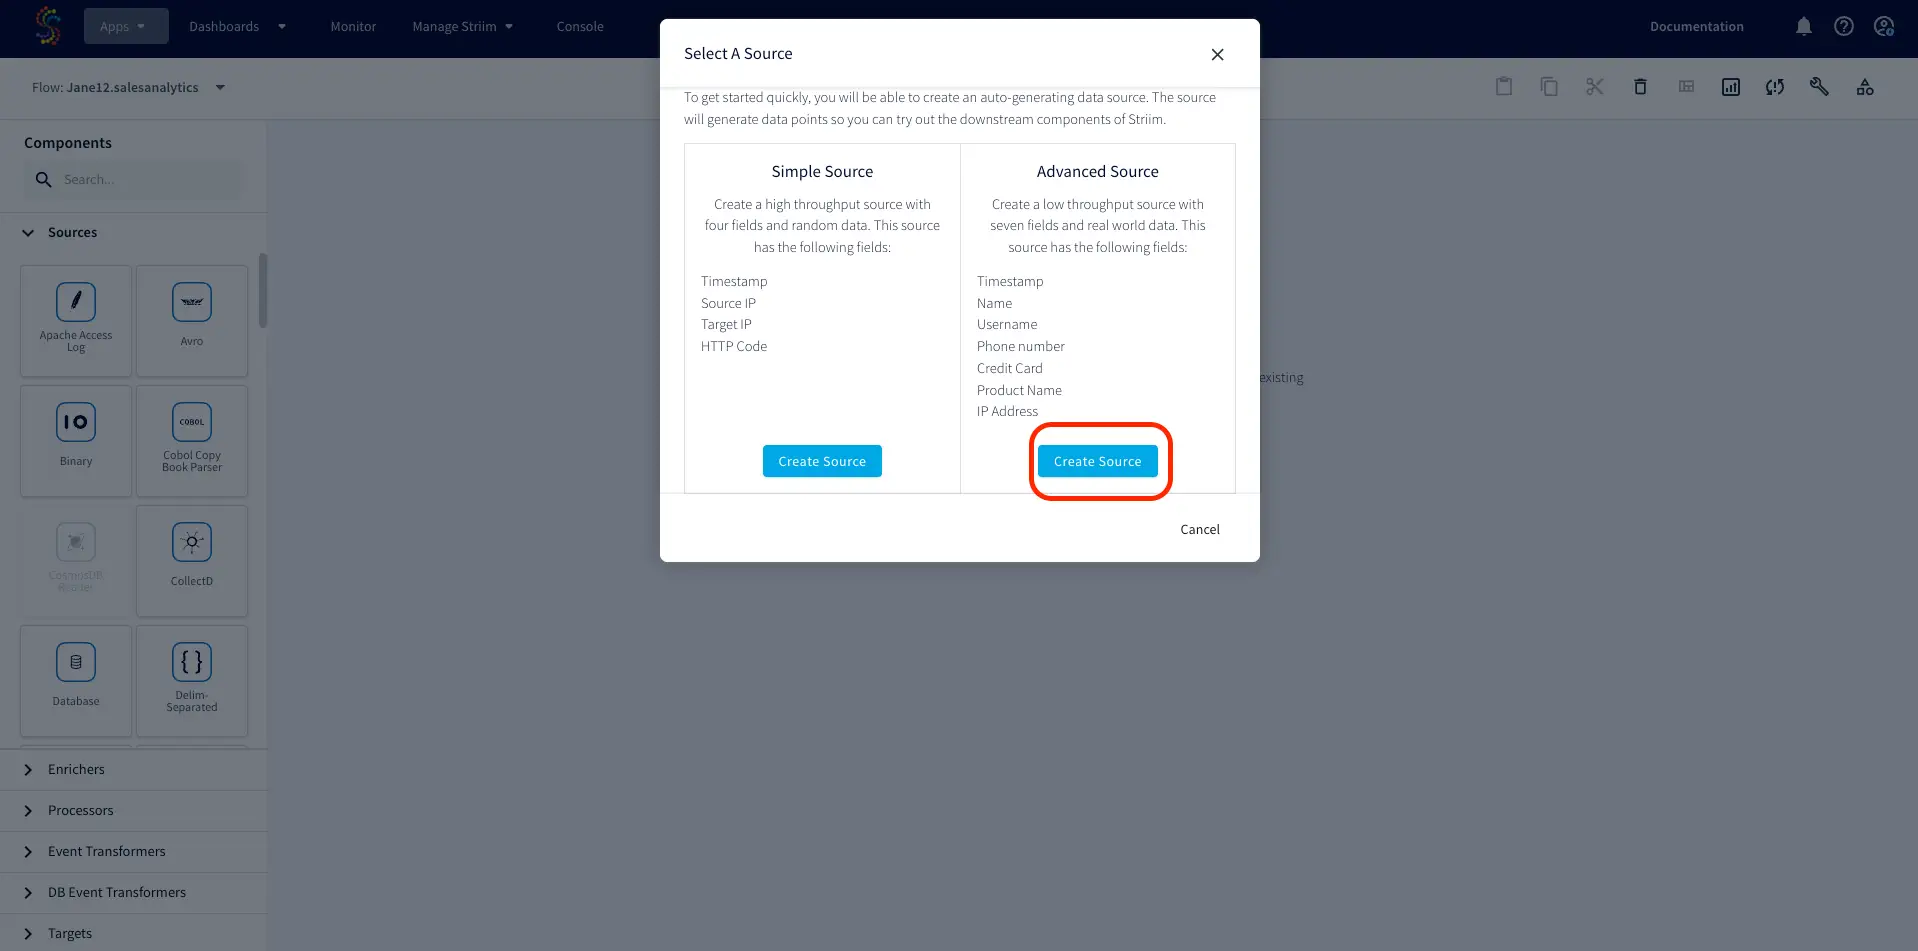
You will have an option to choose between ‘Simple Source’ and ‘Advanced Source’. For this use-case, let us create an advanced source with seven fields. This will start generating streaming sample data.
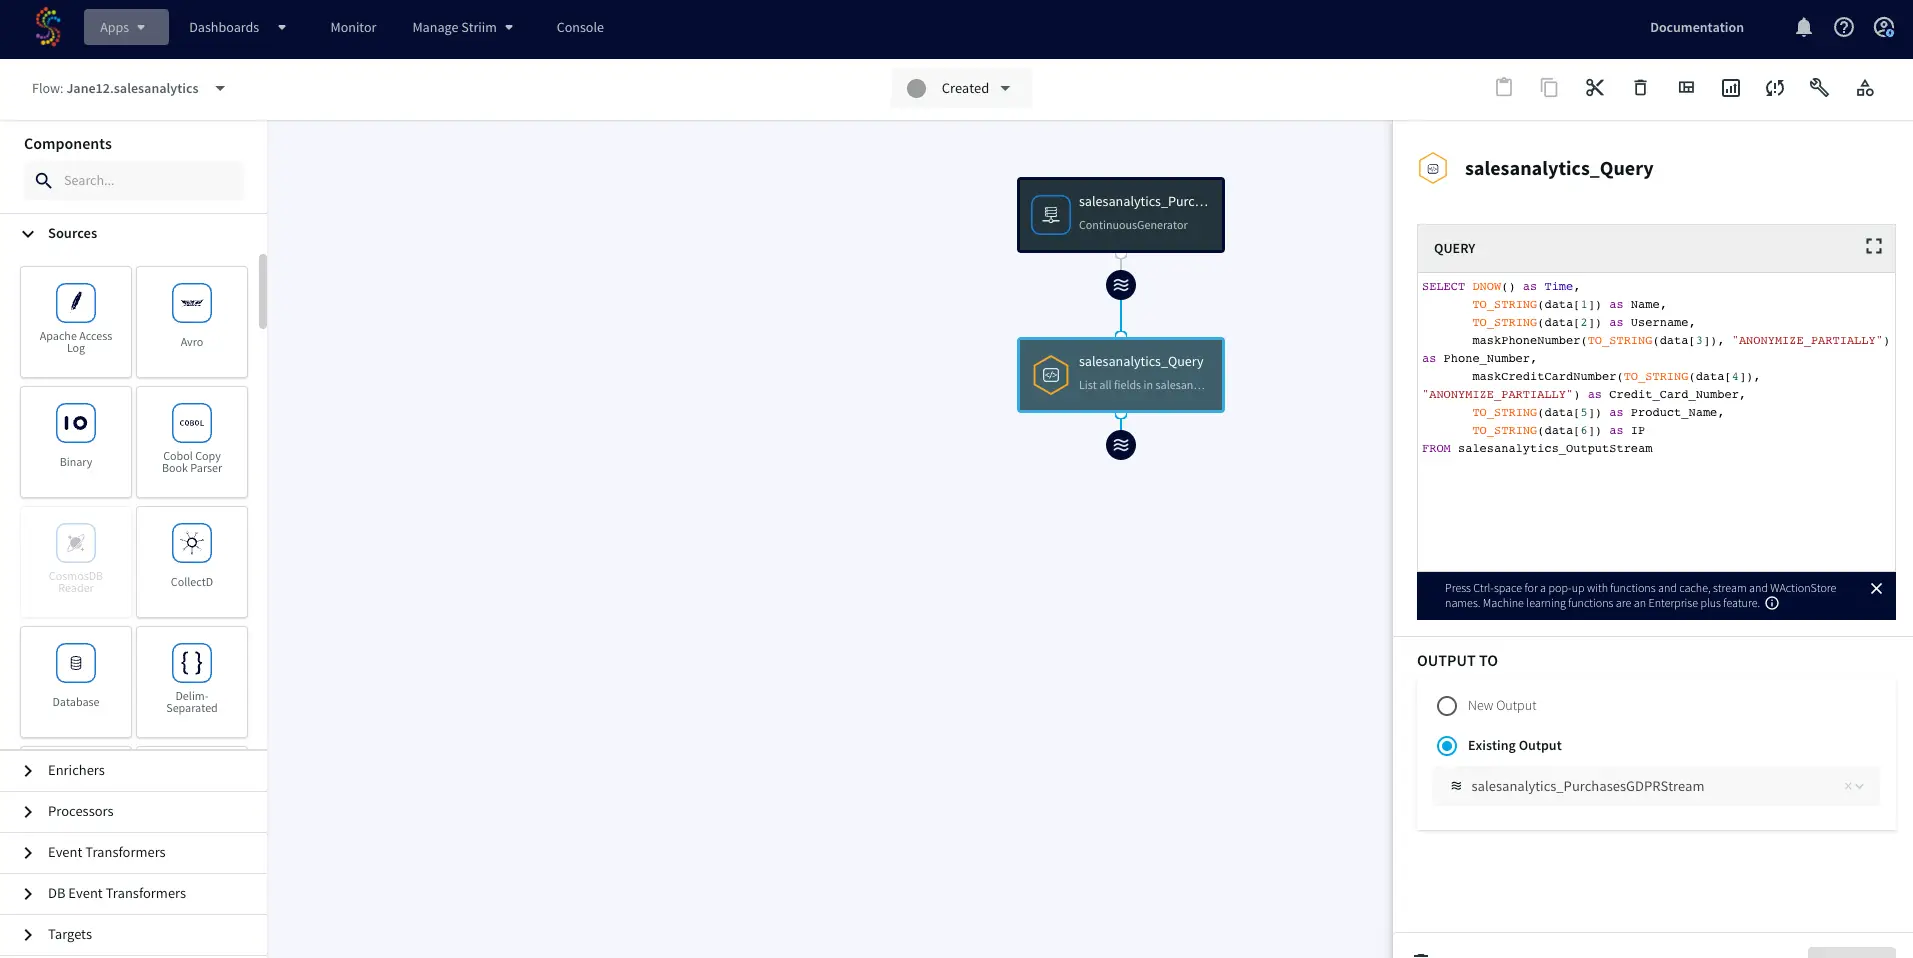
The advanced source comes with a continuous query that processes and analyzes the data stream.
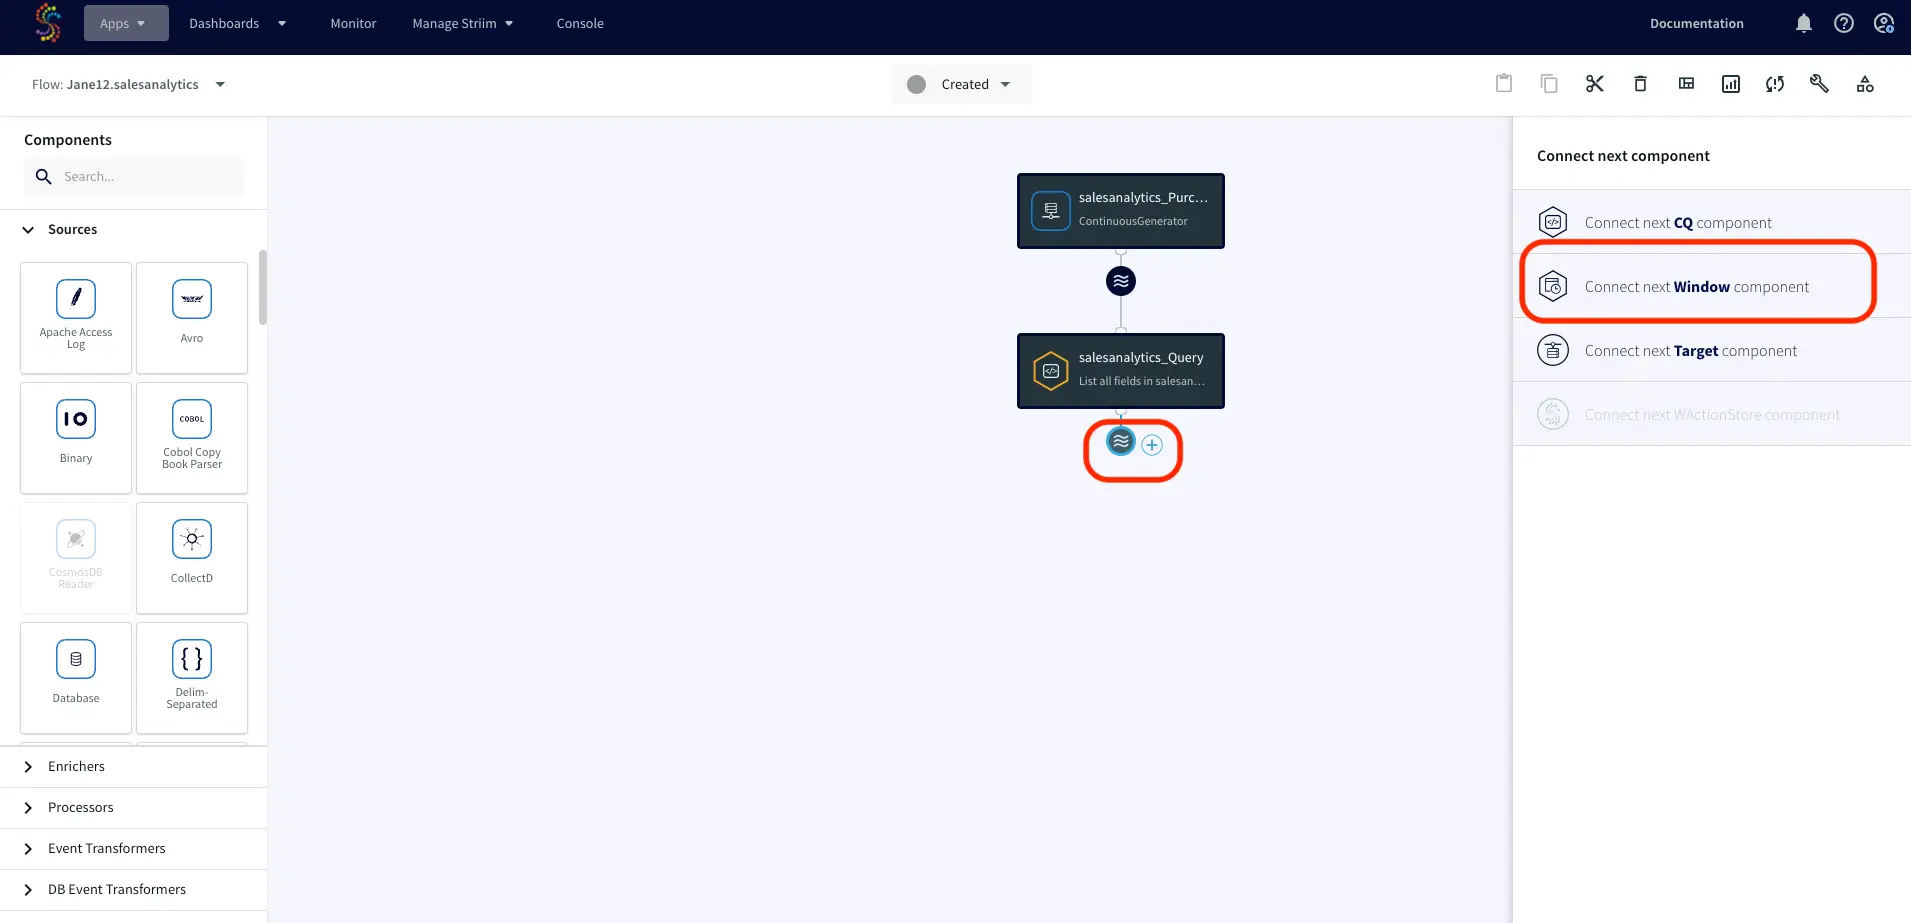
Now a Window component will be added that bounds the streaming data into buckets. Click the ‘+’ button as shown below and select ‘Window’.
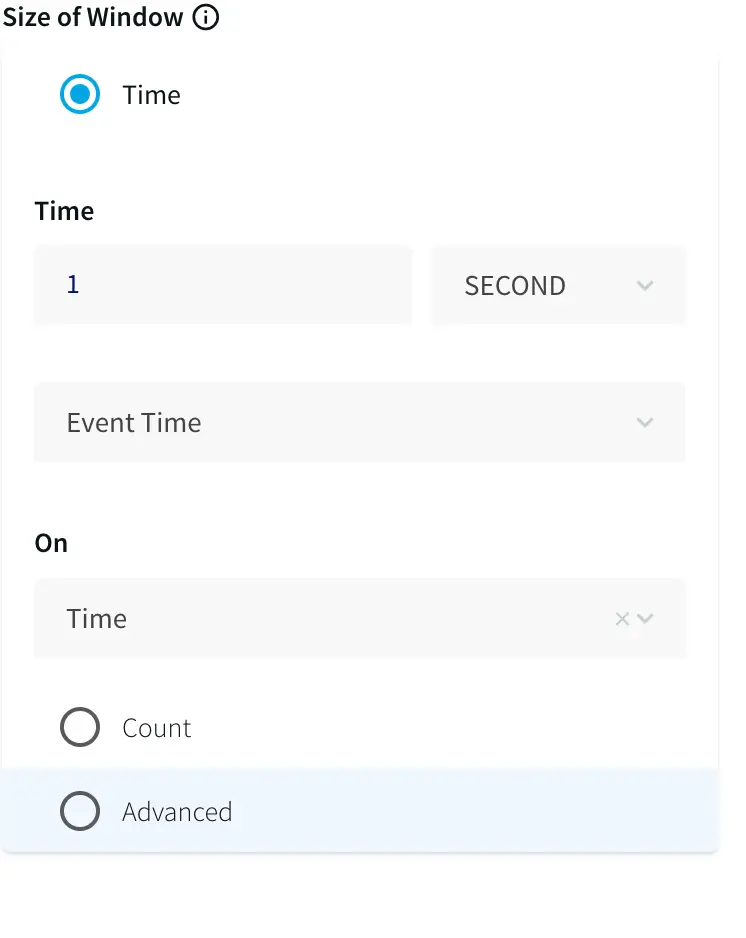
We will set the size of the window to ‘1-second’ on the timestamp of the sample data events. Important: name it ‘onesecondwindow’ for this exercise.
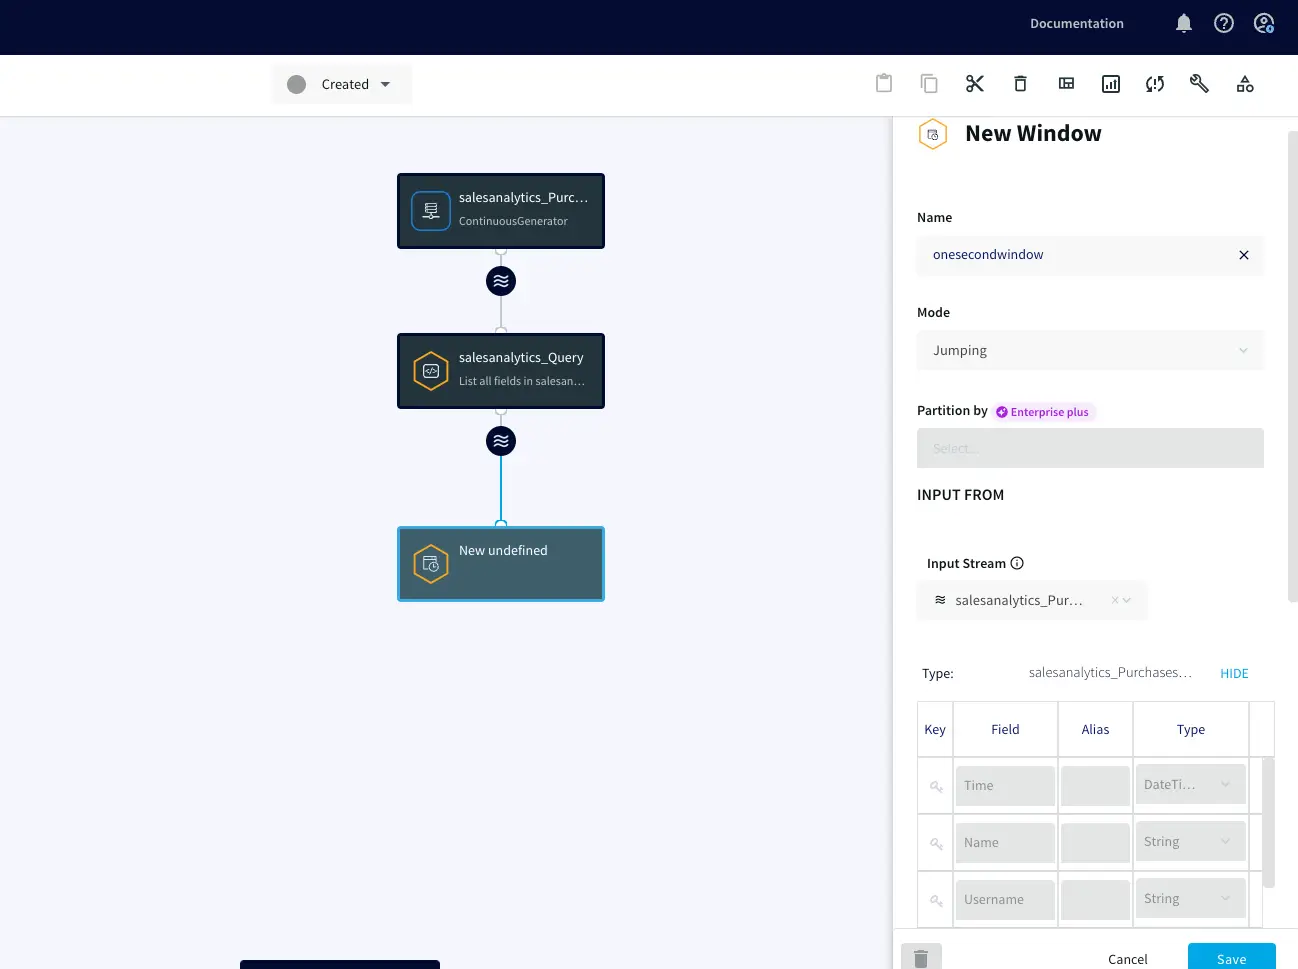
Now scroll down on the window editor and populate the following fields:
Time: 1 Second
on
EventTime
So it looks exactly like this:
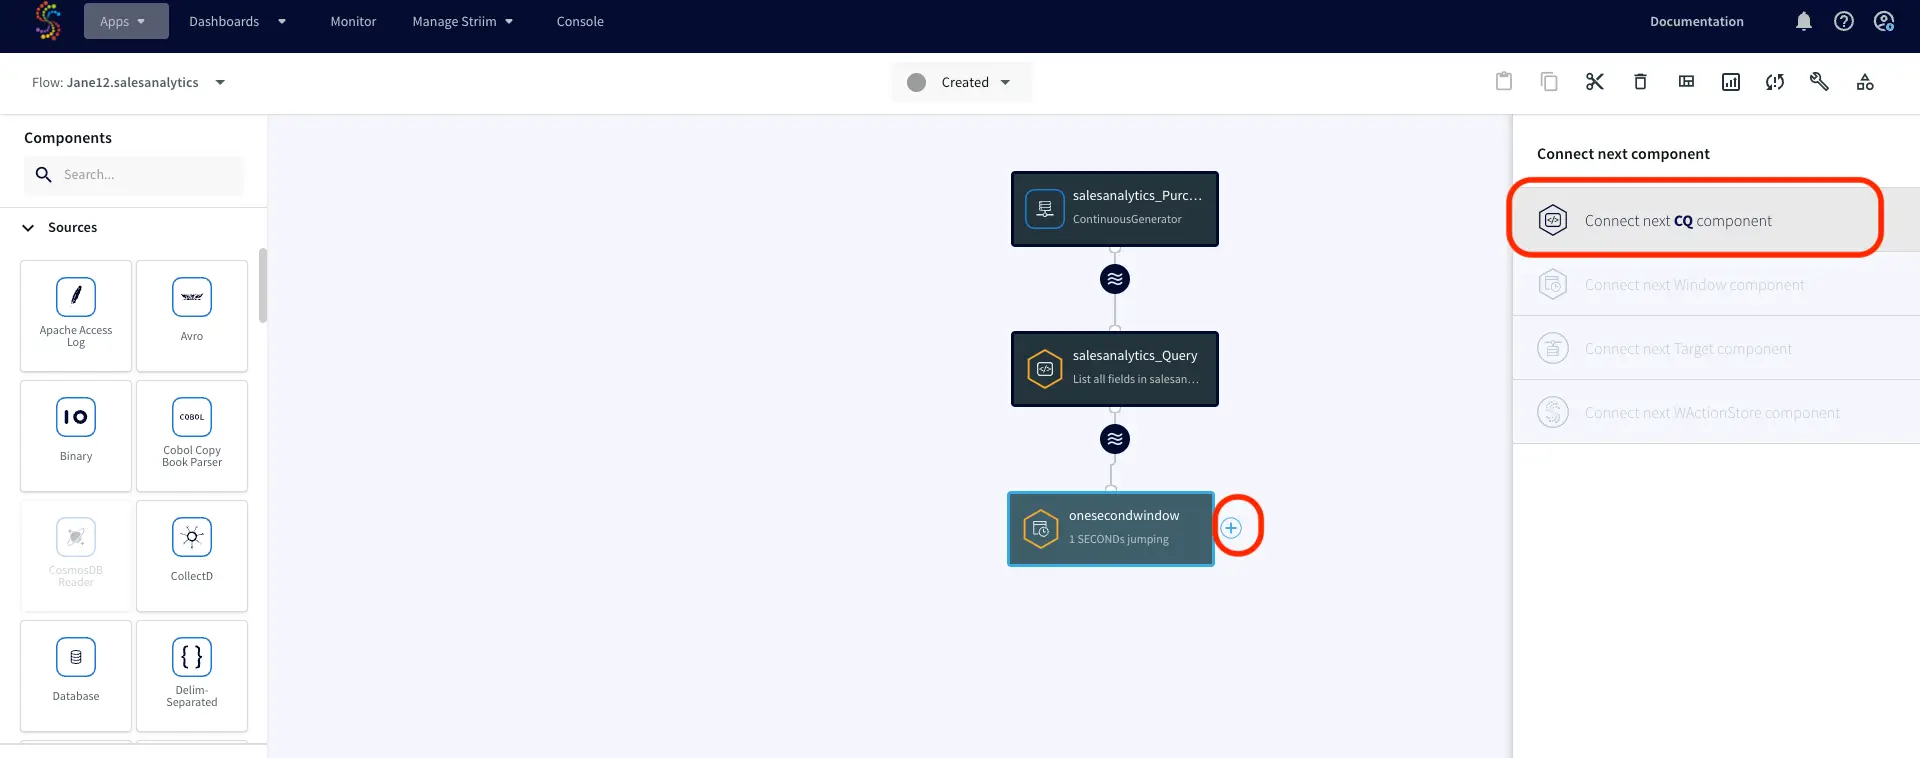
Next we will create a query to analyze this data. A CQ (Continuous Query) will process streaming data in real-time. You can name it ‘getcounts’ or whatever you want (no spaces or special characters). To add a CQ, select ‘+’ and connect next CQ component.
Copy and paste the following Streaming SQL snippet into the ‘CQ’ box:
SELECT count(*) as transactioncount, DNOW() as time FROM
onesecondwindow o;
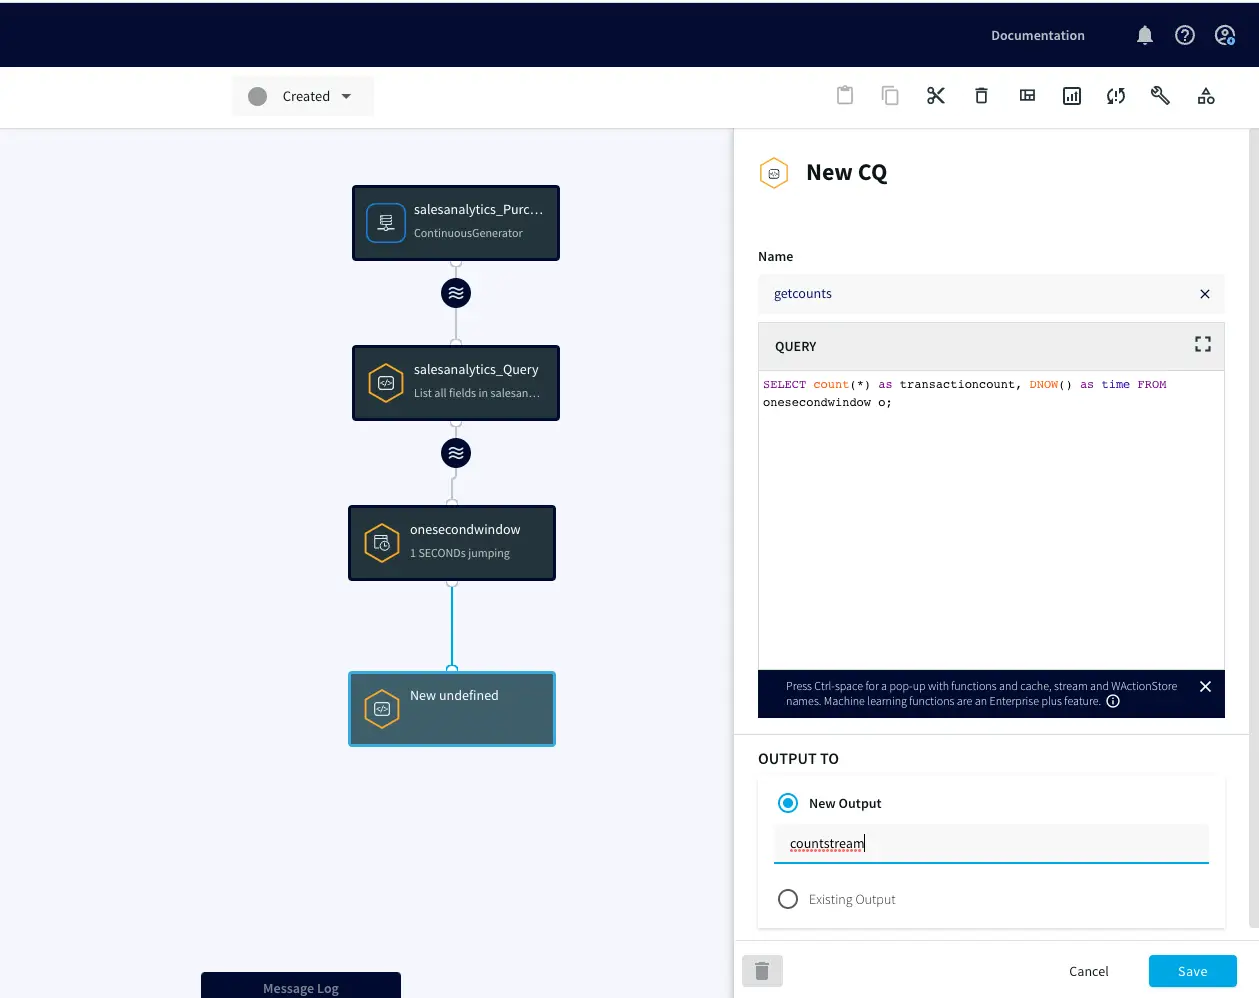
IMPORTANT: name the New Output ‘countstream’.
As you may have noticed, the sample data has an IP address (every computer’s network ID) for each transaction. However, the business wants to know where their customers are coming from and we are missing that data. Luckily, Striim has a way of pulling locations for IP addresses.
Click and drag another ‘Continuous Query’ from the left-side panel on to the flow designer panel (anywhere on the blank/white space)
You can name the component ‘getlocations’ or whatever you want (no special characters or whitespaces)
Now copy and paste the following snippet in to the query box:
SELECT s.Name,s.Product_Name, IP_LAT(s.IP) as latitude, IP_LON(s.IP) as longitude, IP_COUNTRY(s.IP) FROM salesanalytics_PurchasesGDPRStream s;
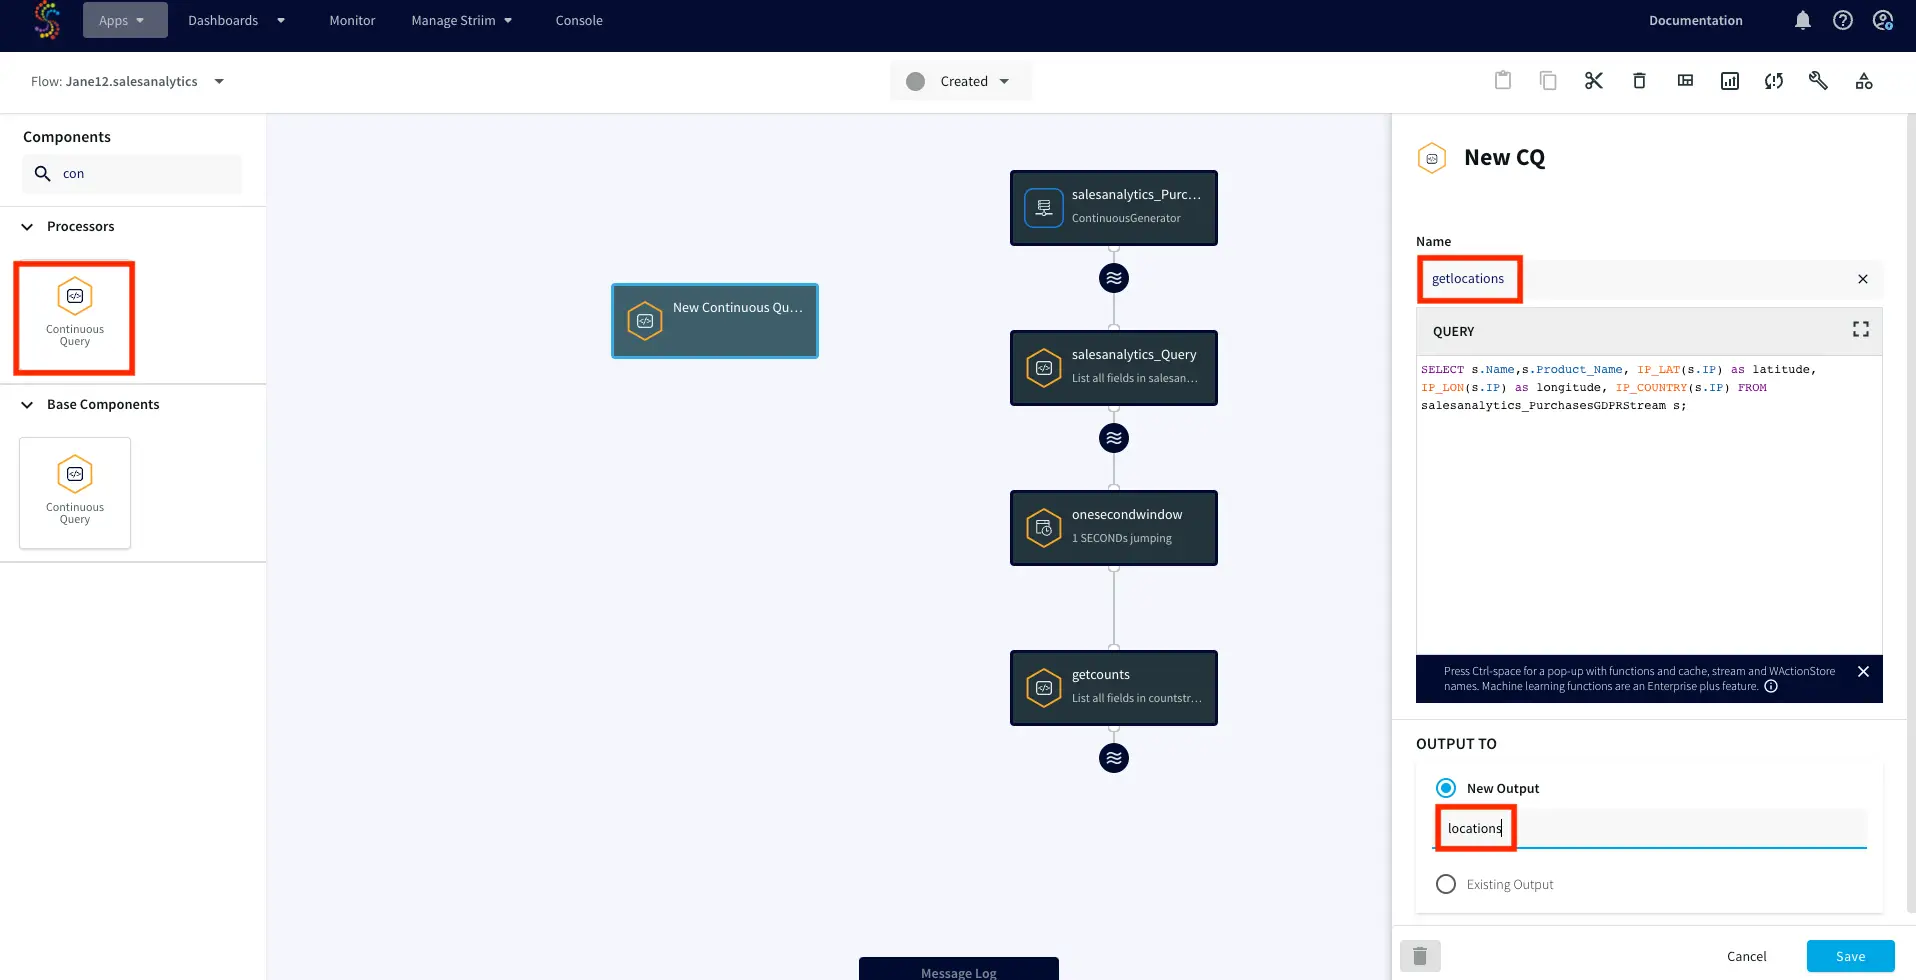
IMPORTANT: name the New Output ‘locations’
Step 3: Deploy and Run your Striim Application
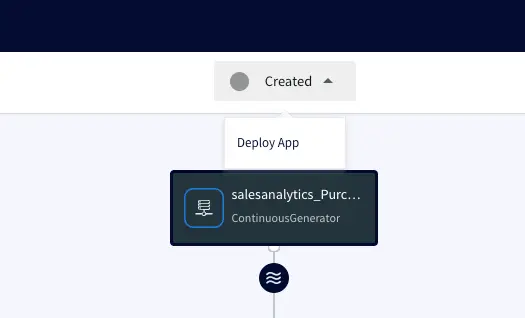
After you have saved all the components of your streaming app, you may deploy and run the Striim application. Click on the dropdown list next to ‘Created’ and choose ‘Deploy App’.
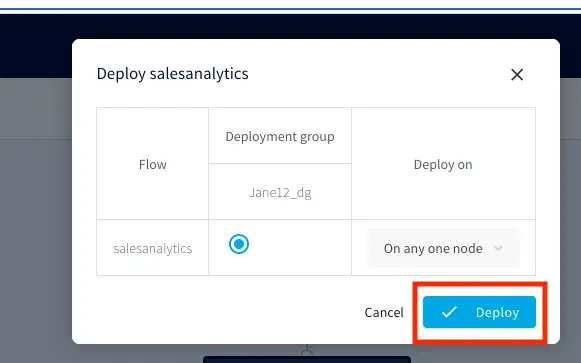
You can select any available deployment group and click ‘Deploy’.
After your Striim app is deployed, you can run the streaming application by clicking ‘Start App’.
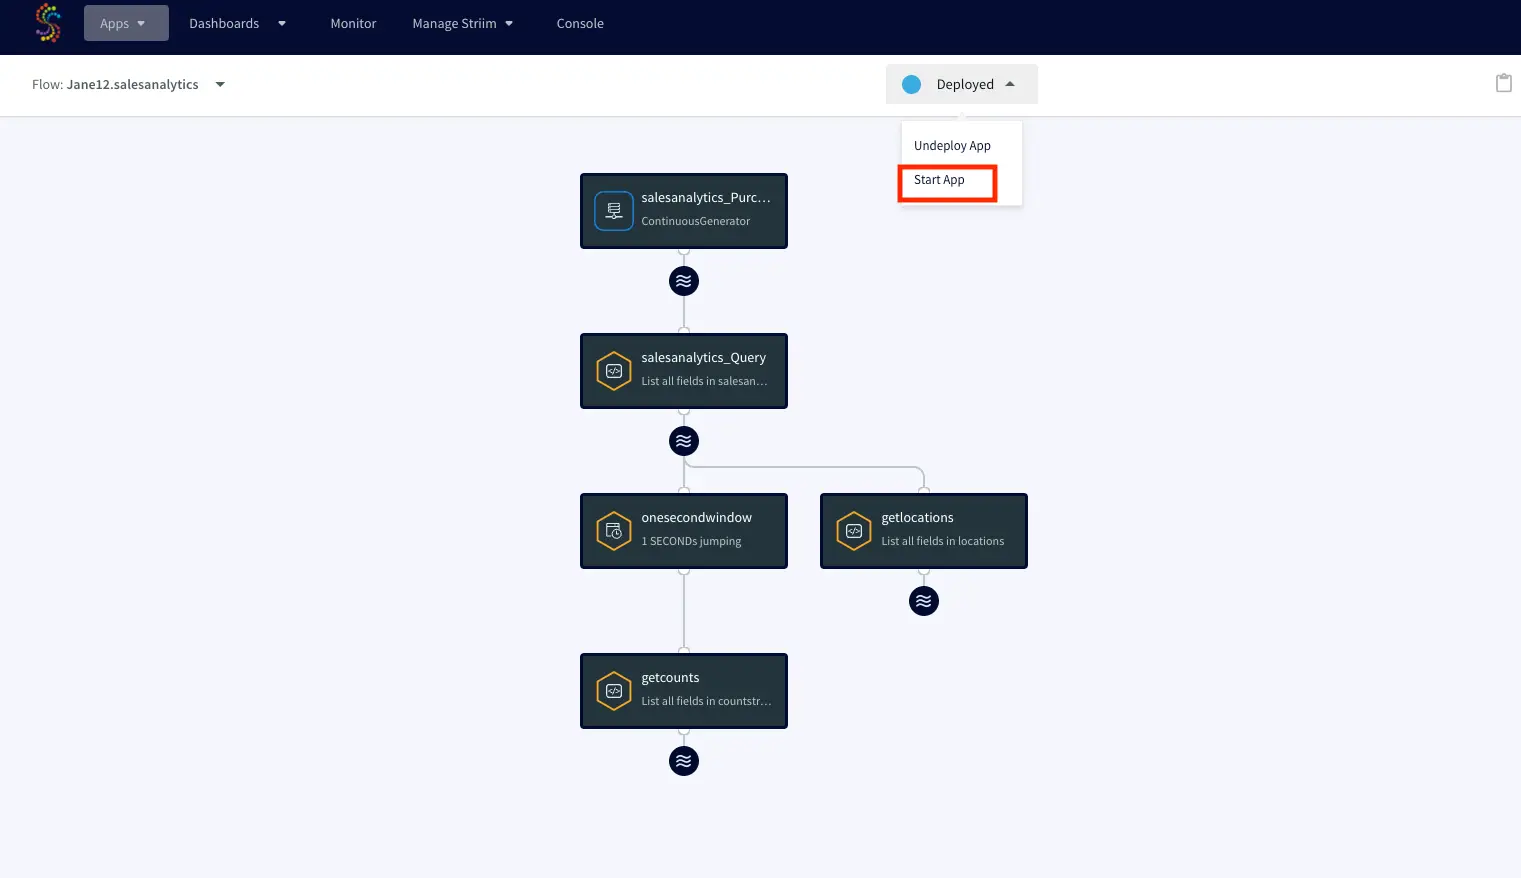
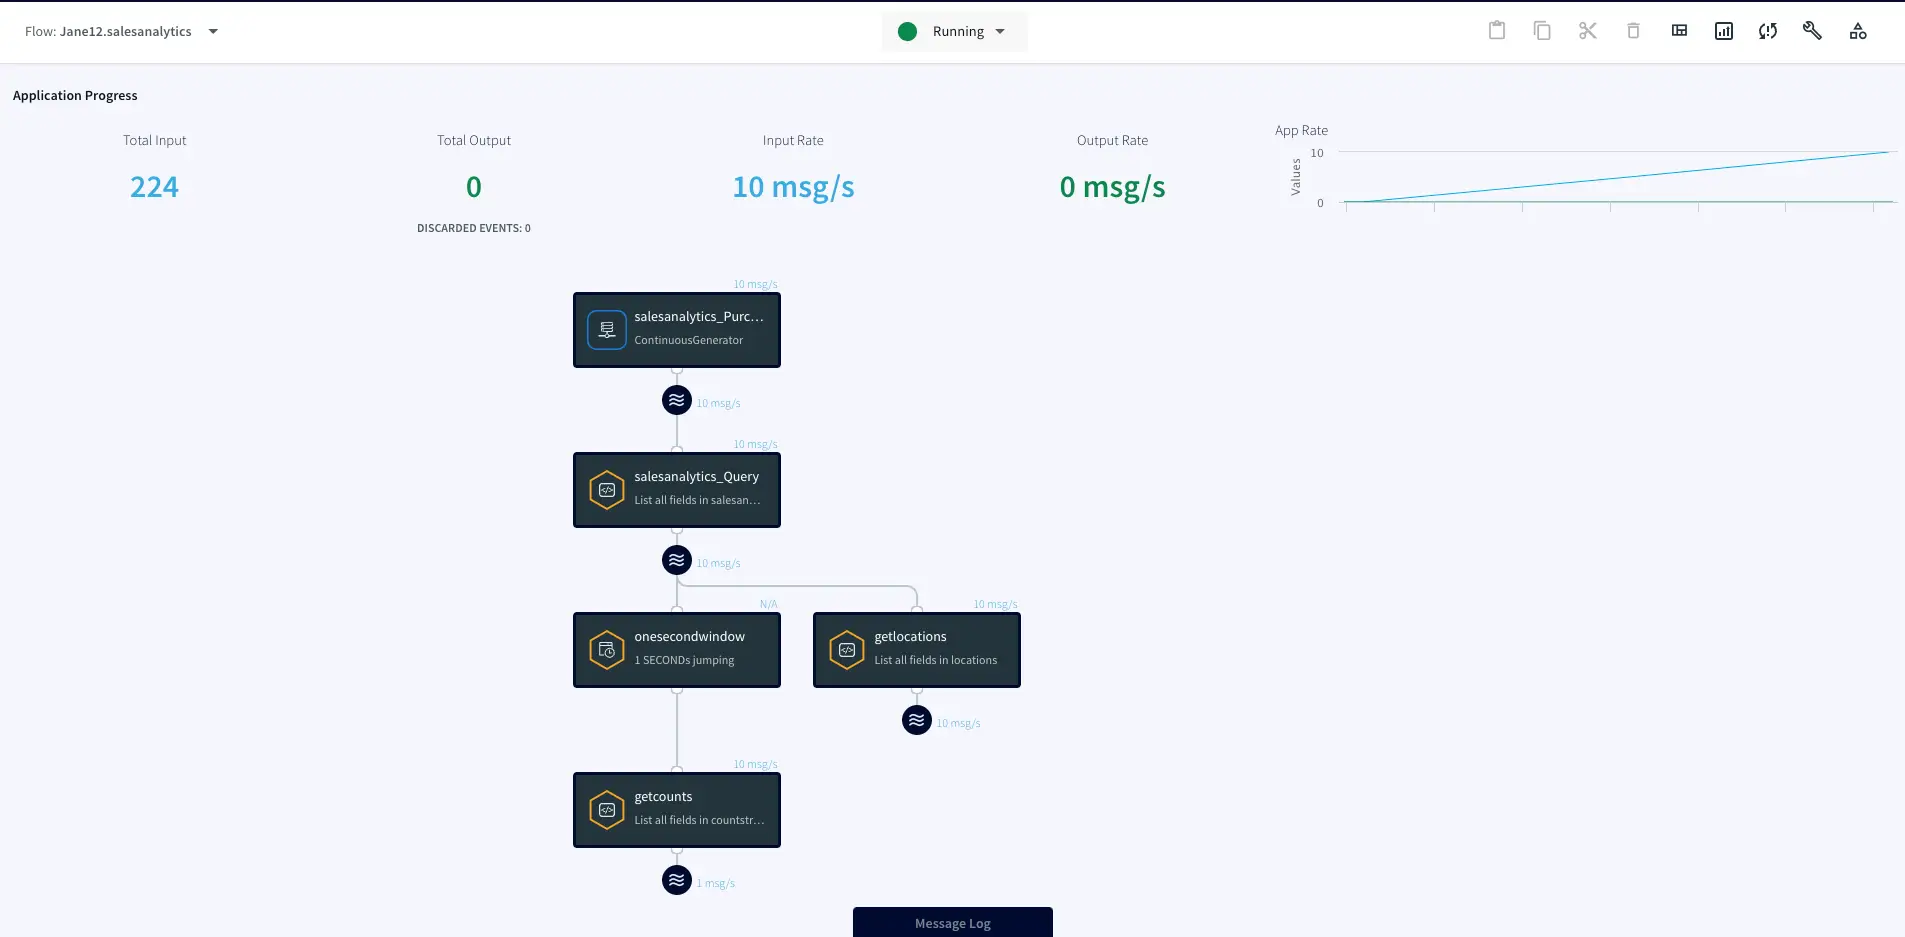
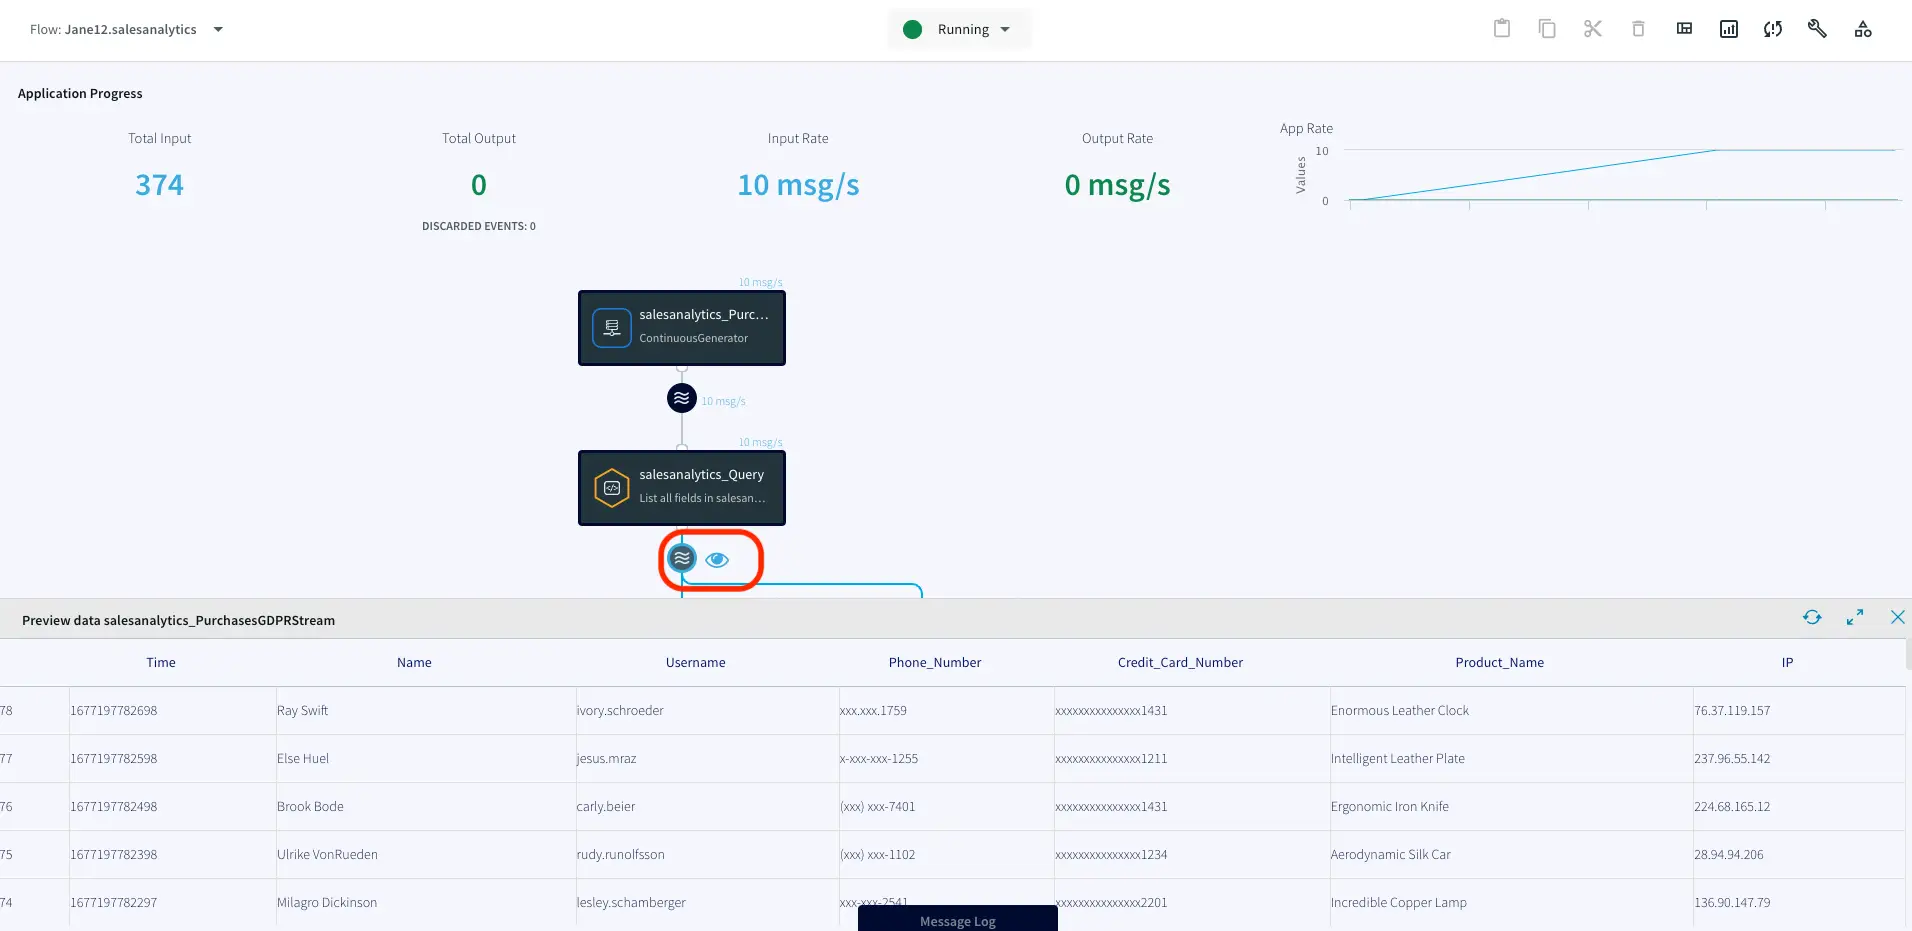
You can monitor the processed data through the ‘eye’ wizard next to any stream component.
Explore Striim Dashboards
A Striim dashboard gives you a visual representation of data read and written by a Striim application. We will create a dashboard for the above data stream to visualize streaming data in real-time. Start by downloading this file.
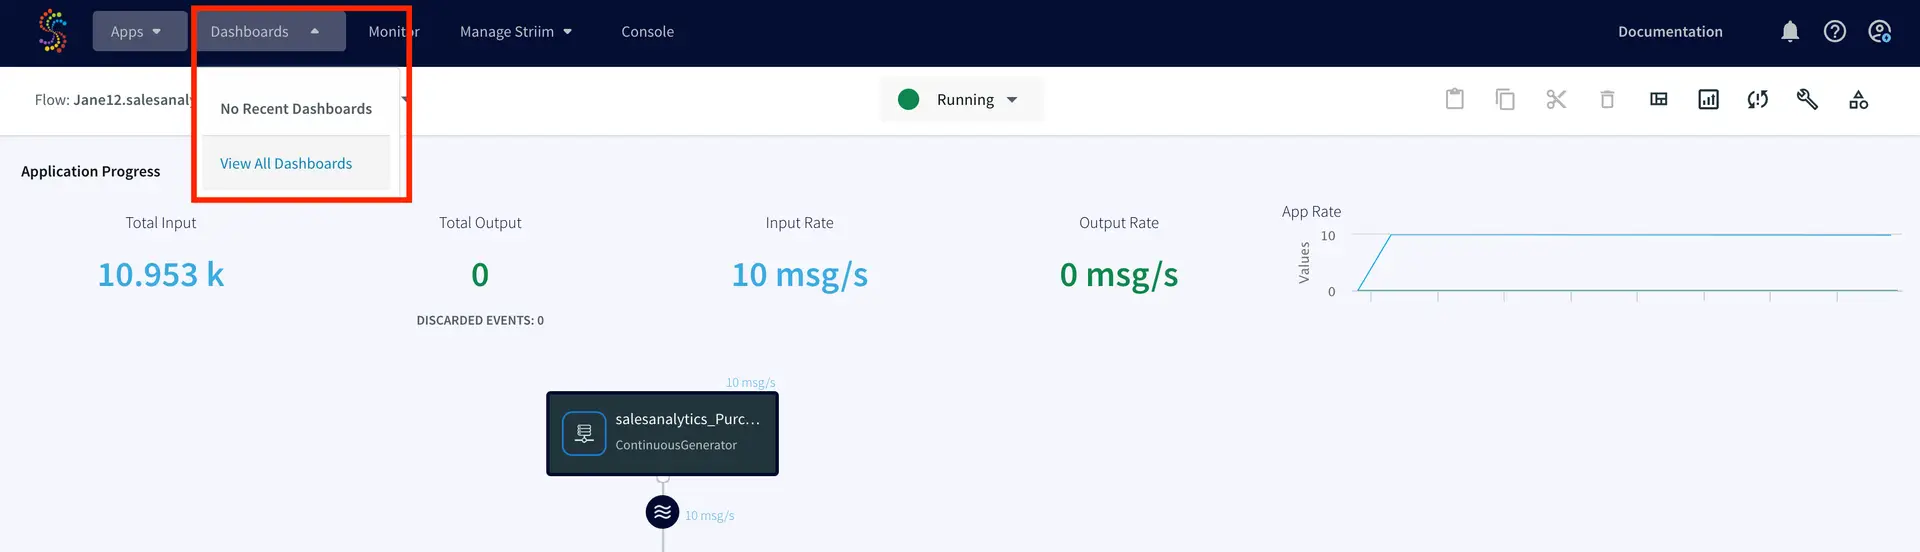
Click on ‘View All Dashboards’ from the dropdown next to ‘Dashboards’ at the top of screen.
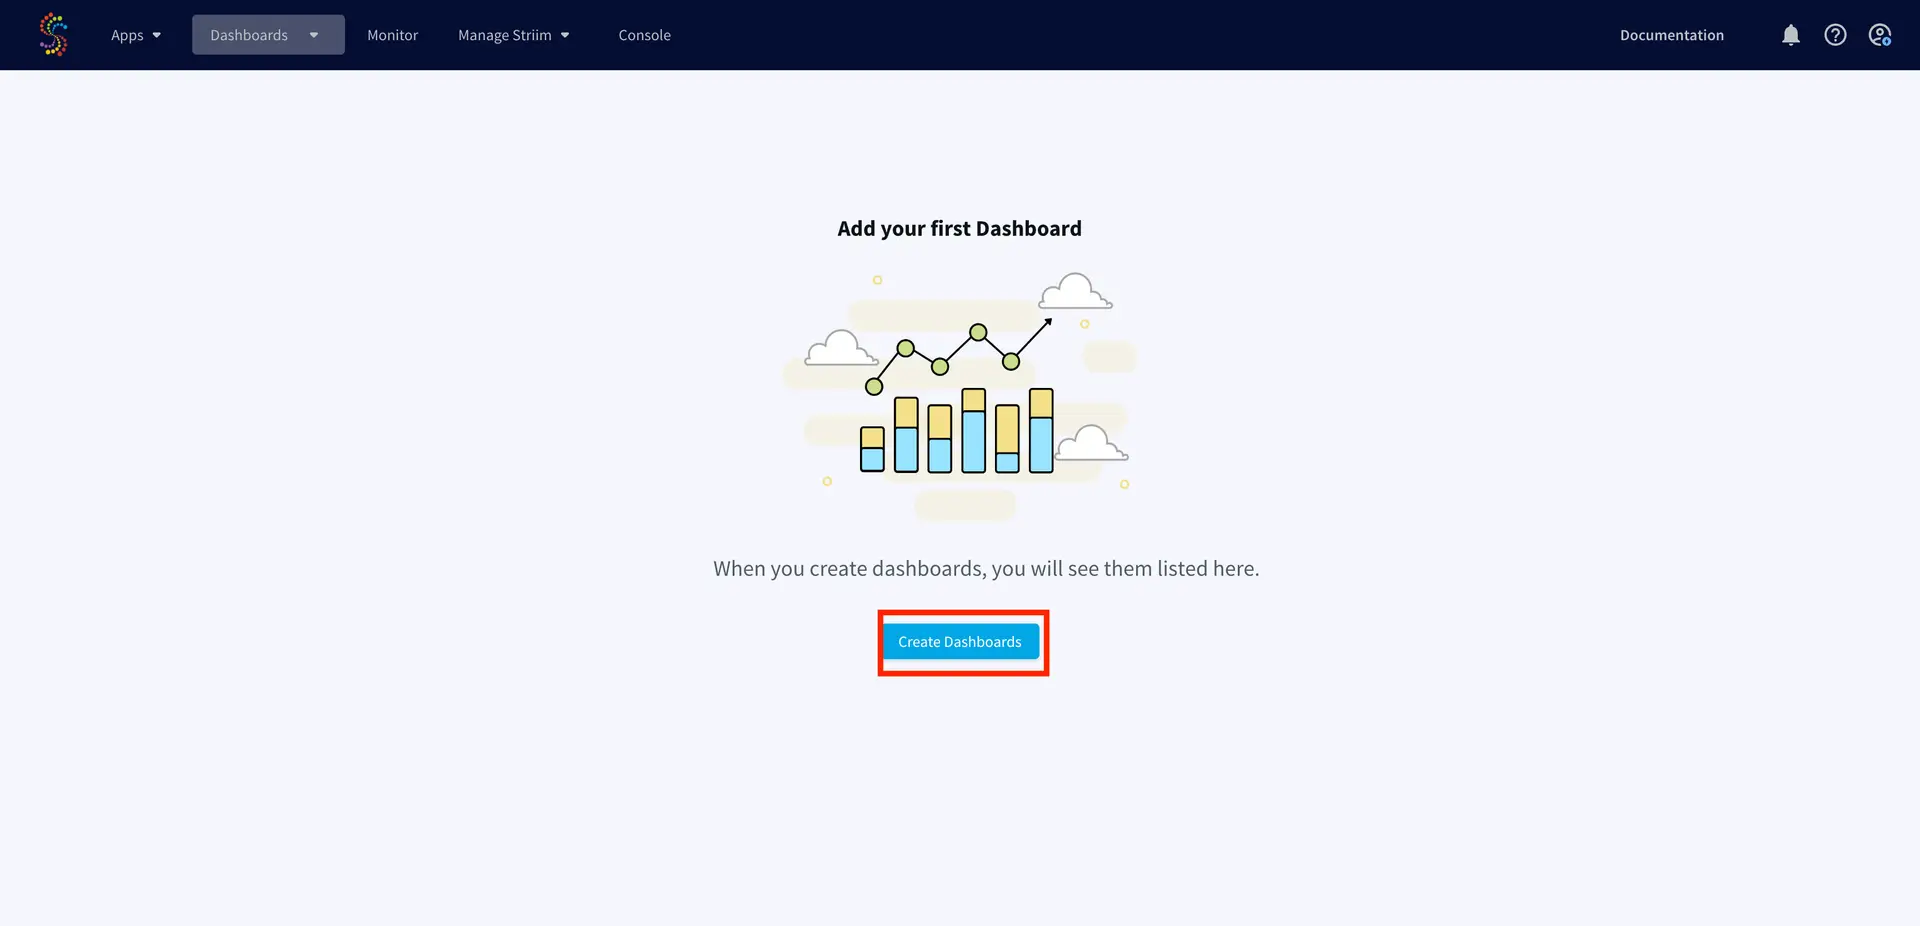
Click on ‘Create Dashboard’ and import the above downloaded file and select ‘Import all queries into this namespace’ using the auto selected namespace.
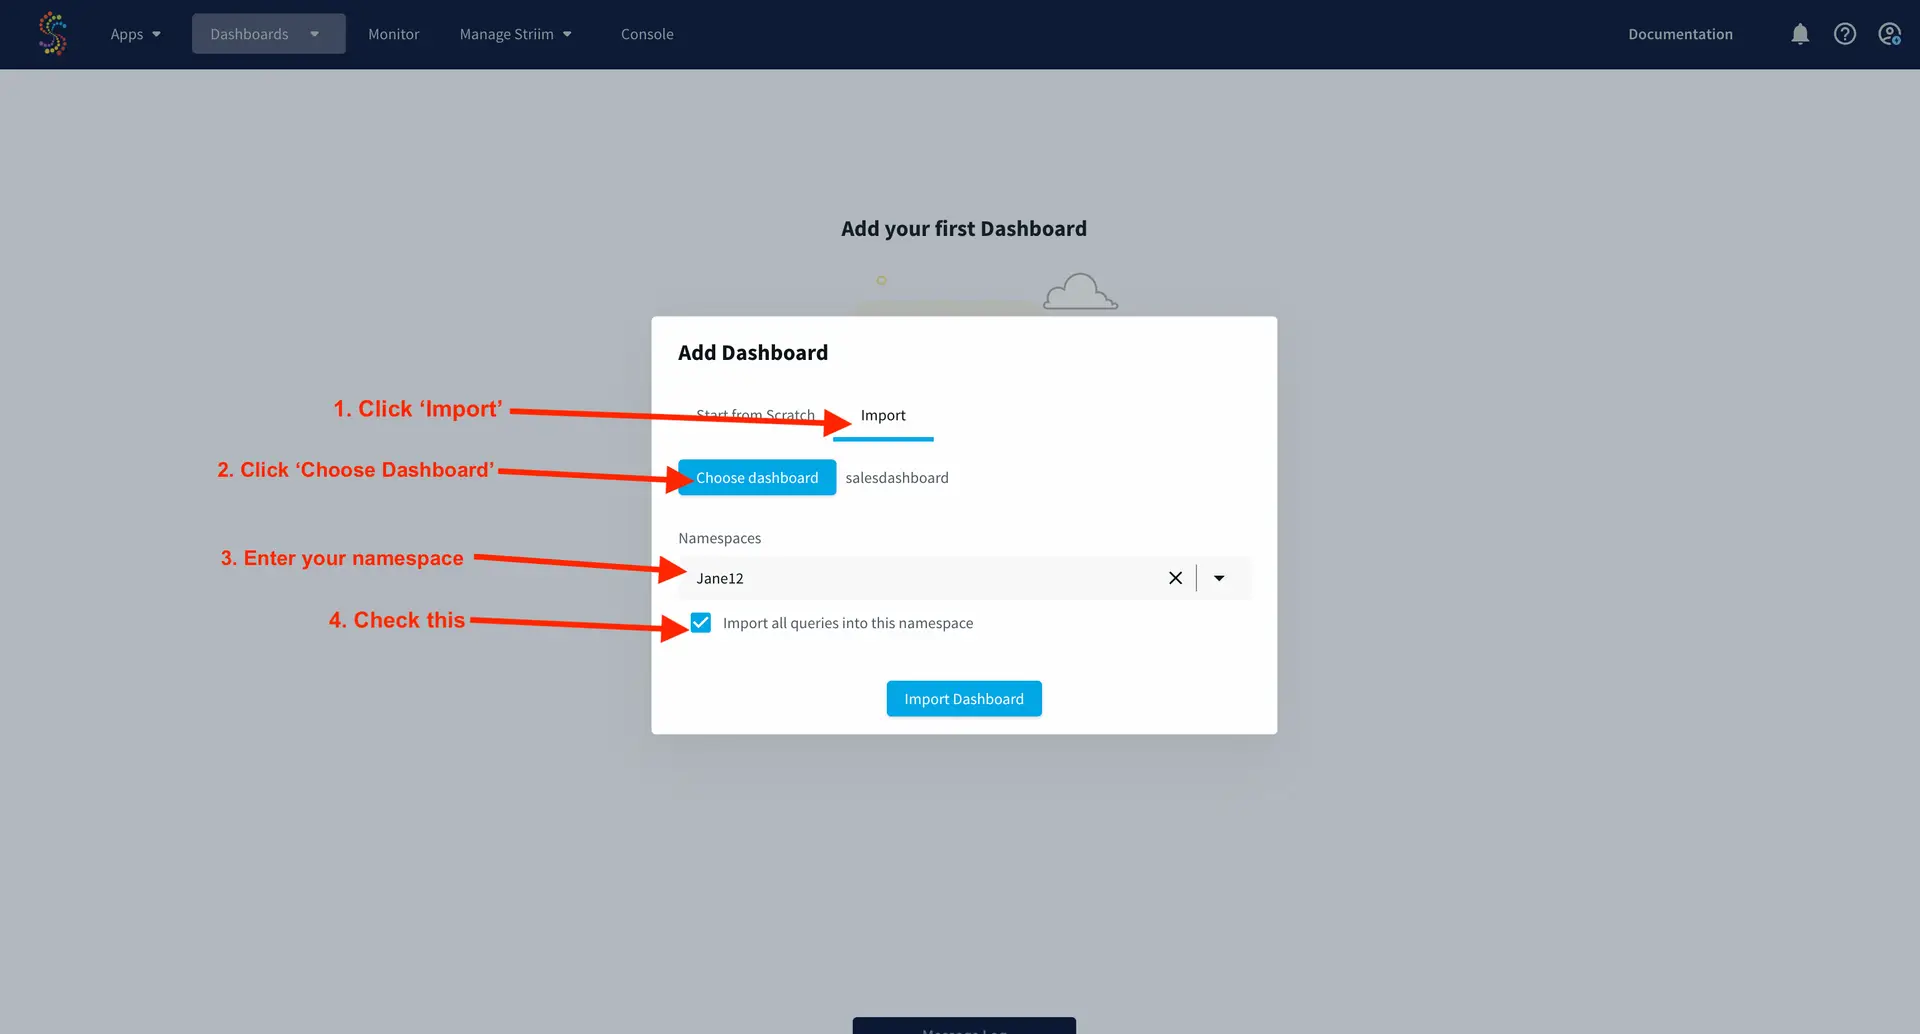
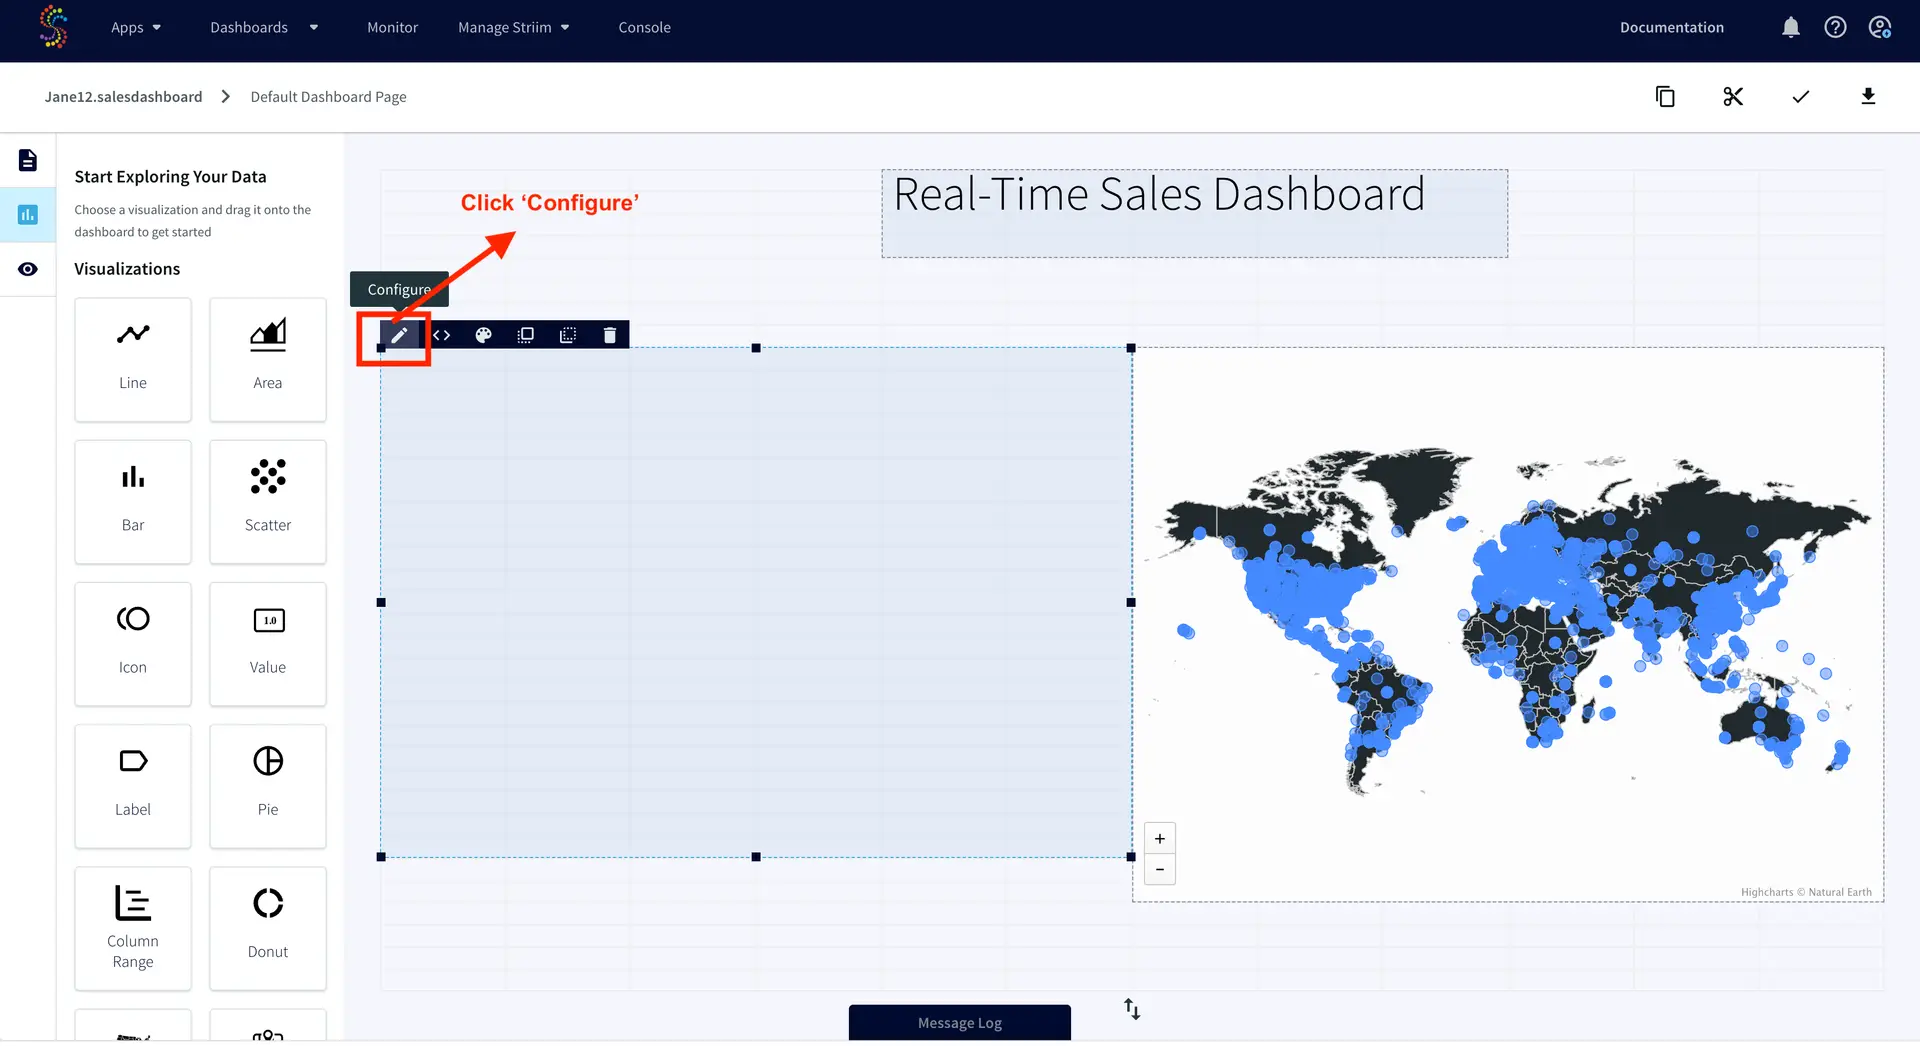
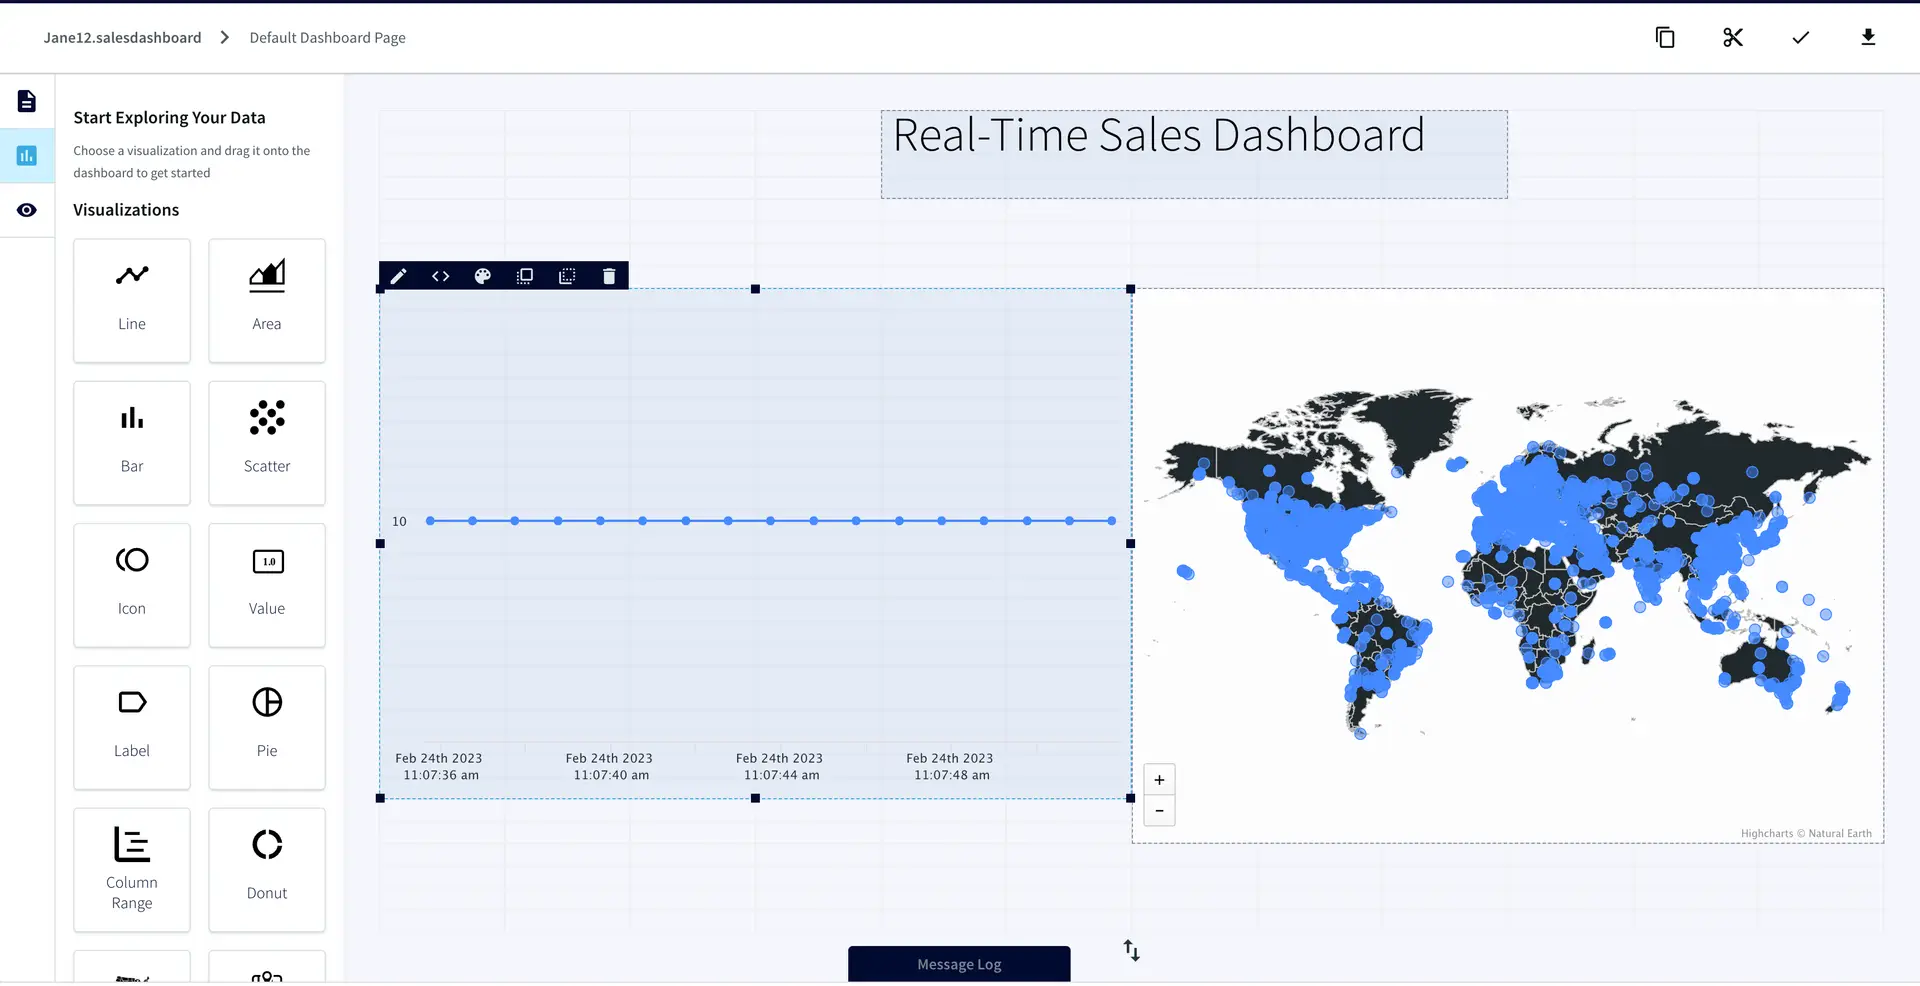
Here you will see a Striim Dashboard with a map already created. You will create a real-time chart yourself!
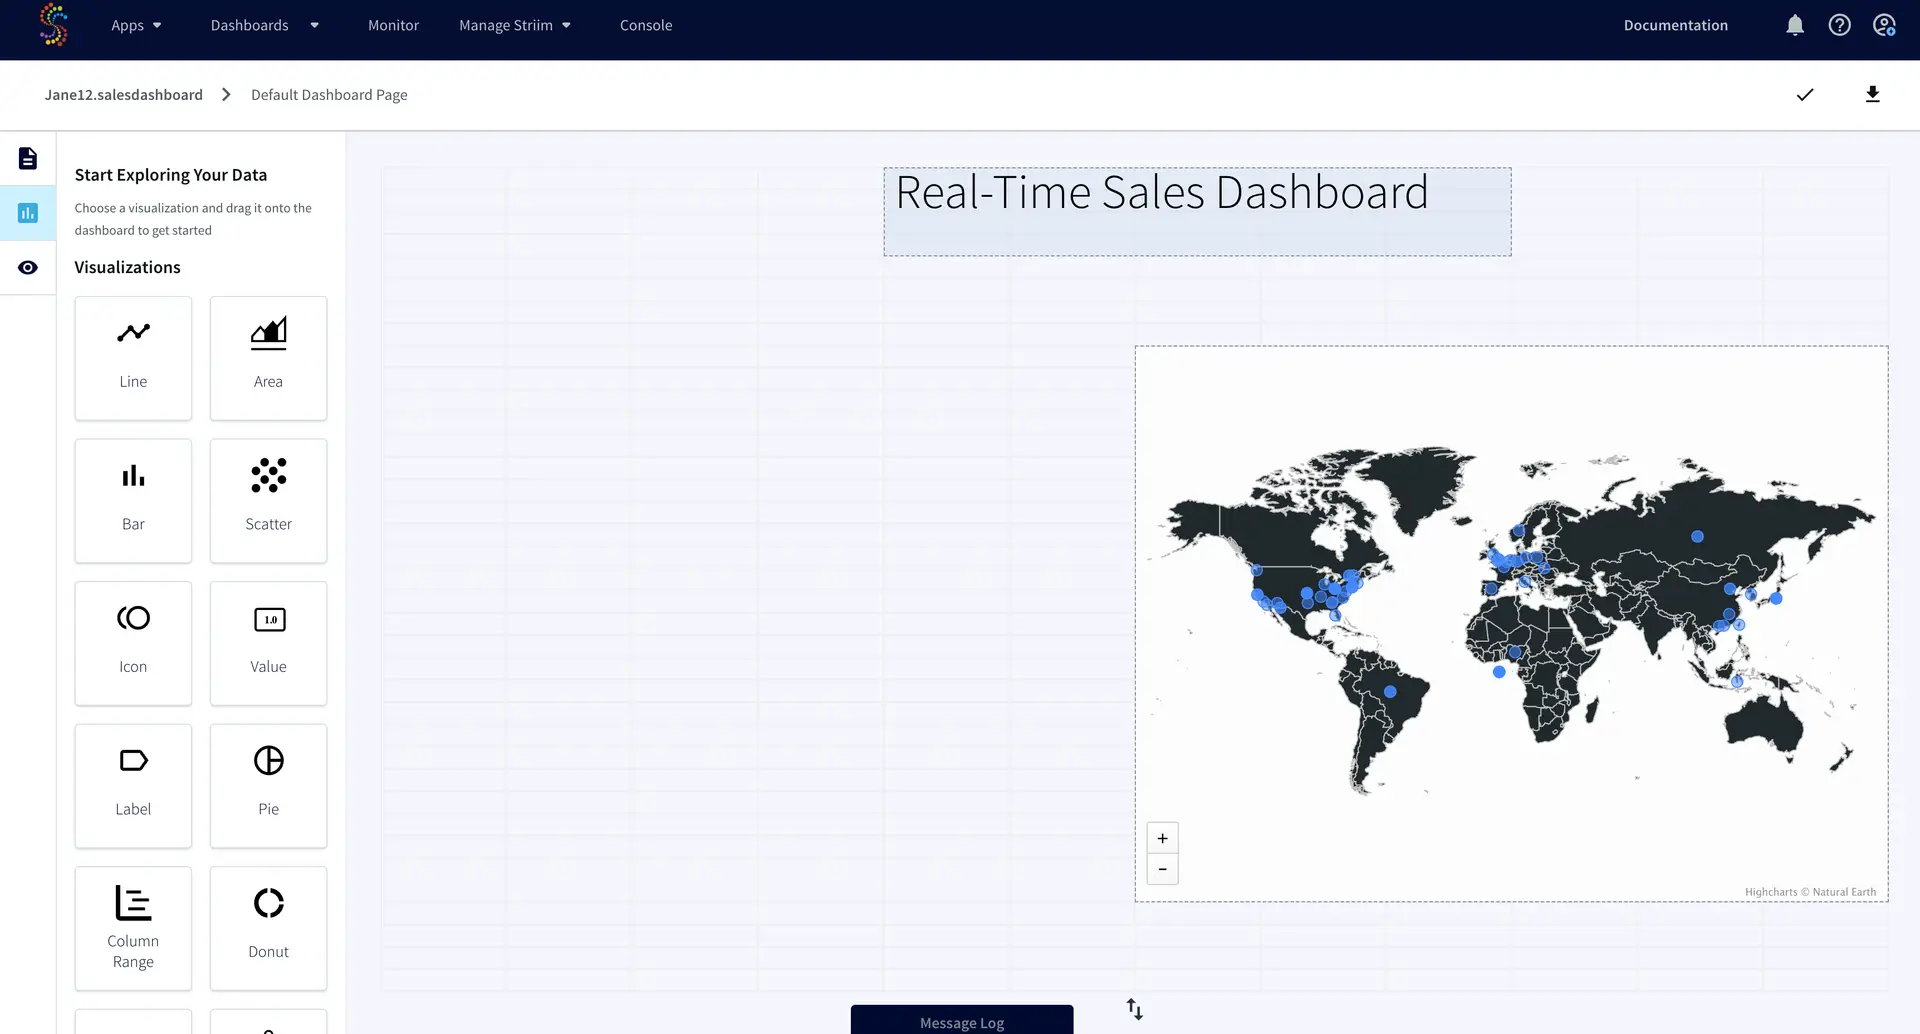
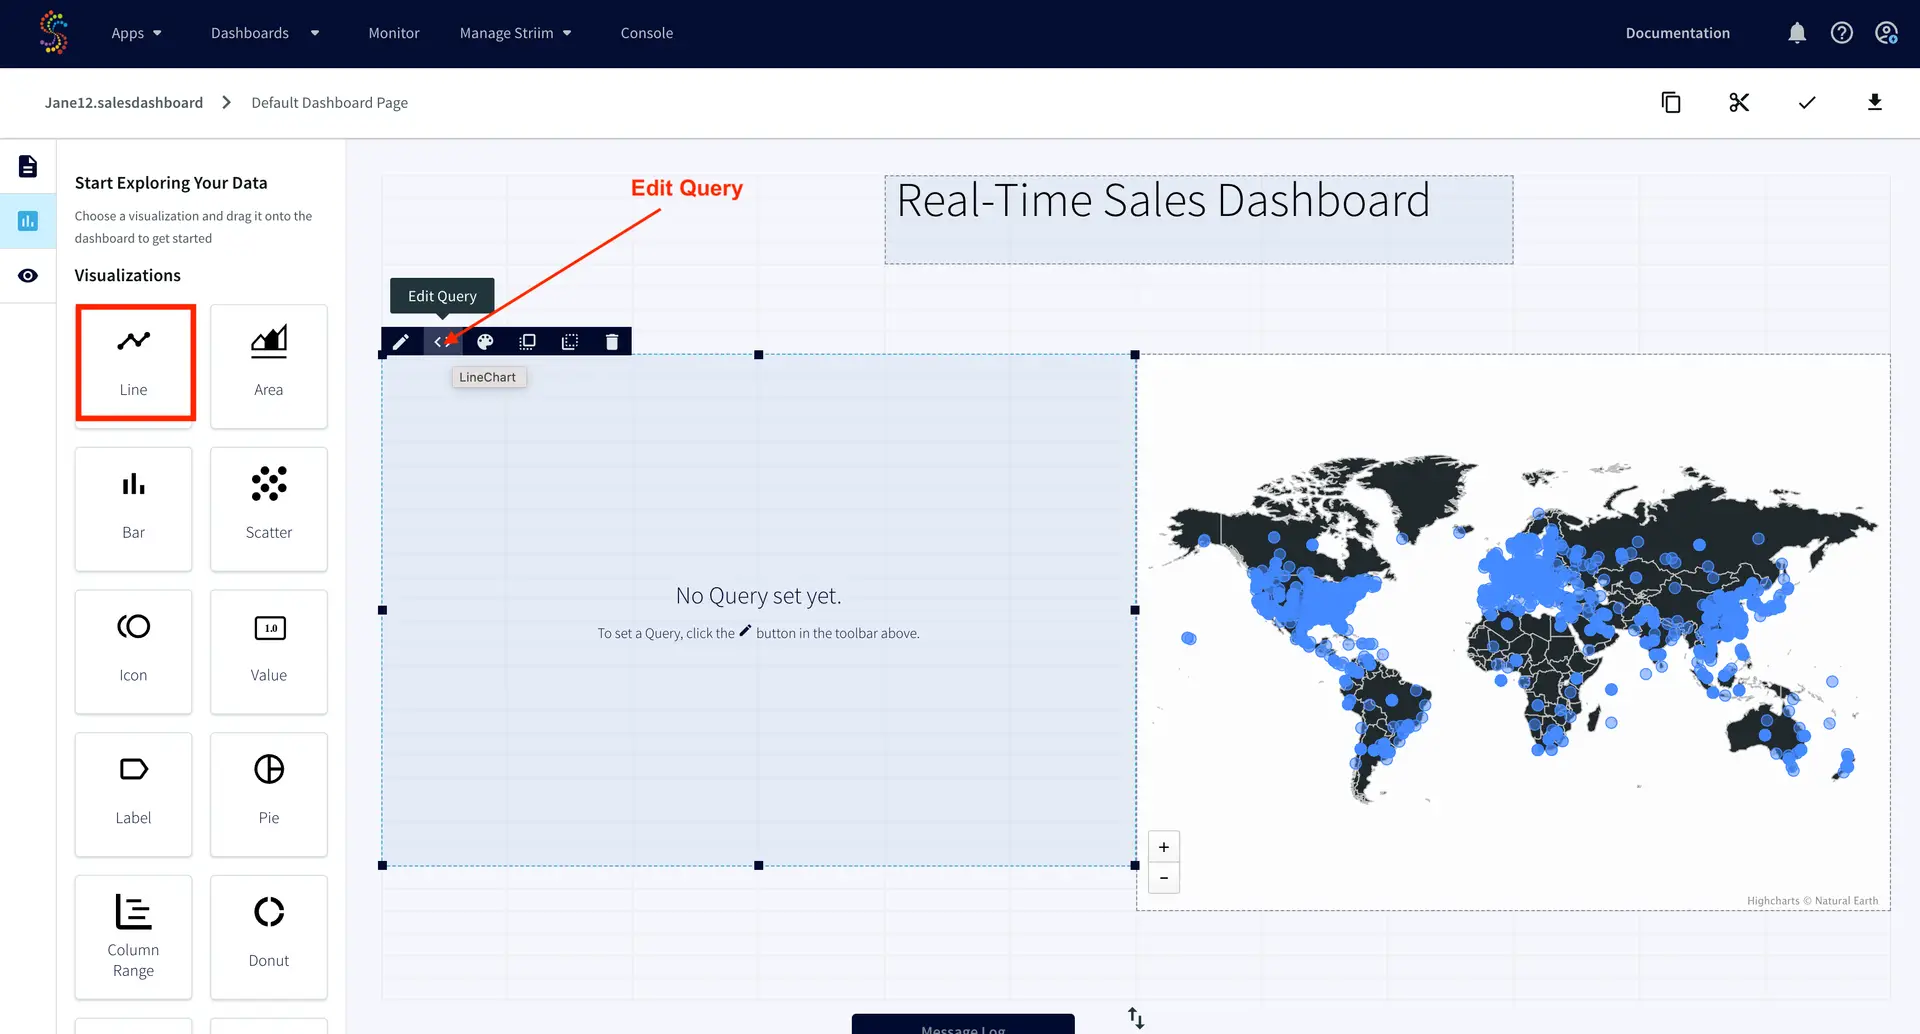
We will now create a line chart with our sales data. Click the ‘Line’ chart on the left side, drag it into the panel. Then select ‘Edit Query’ on the ‘<>’ icon on the top left.
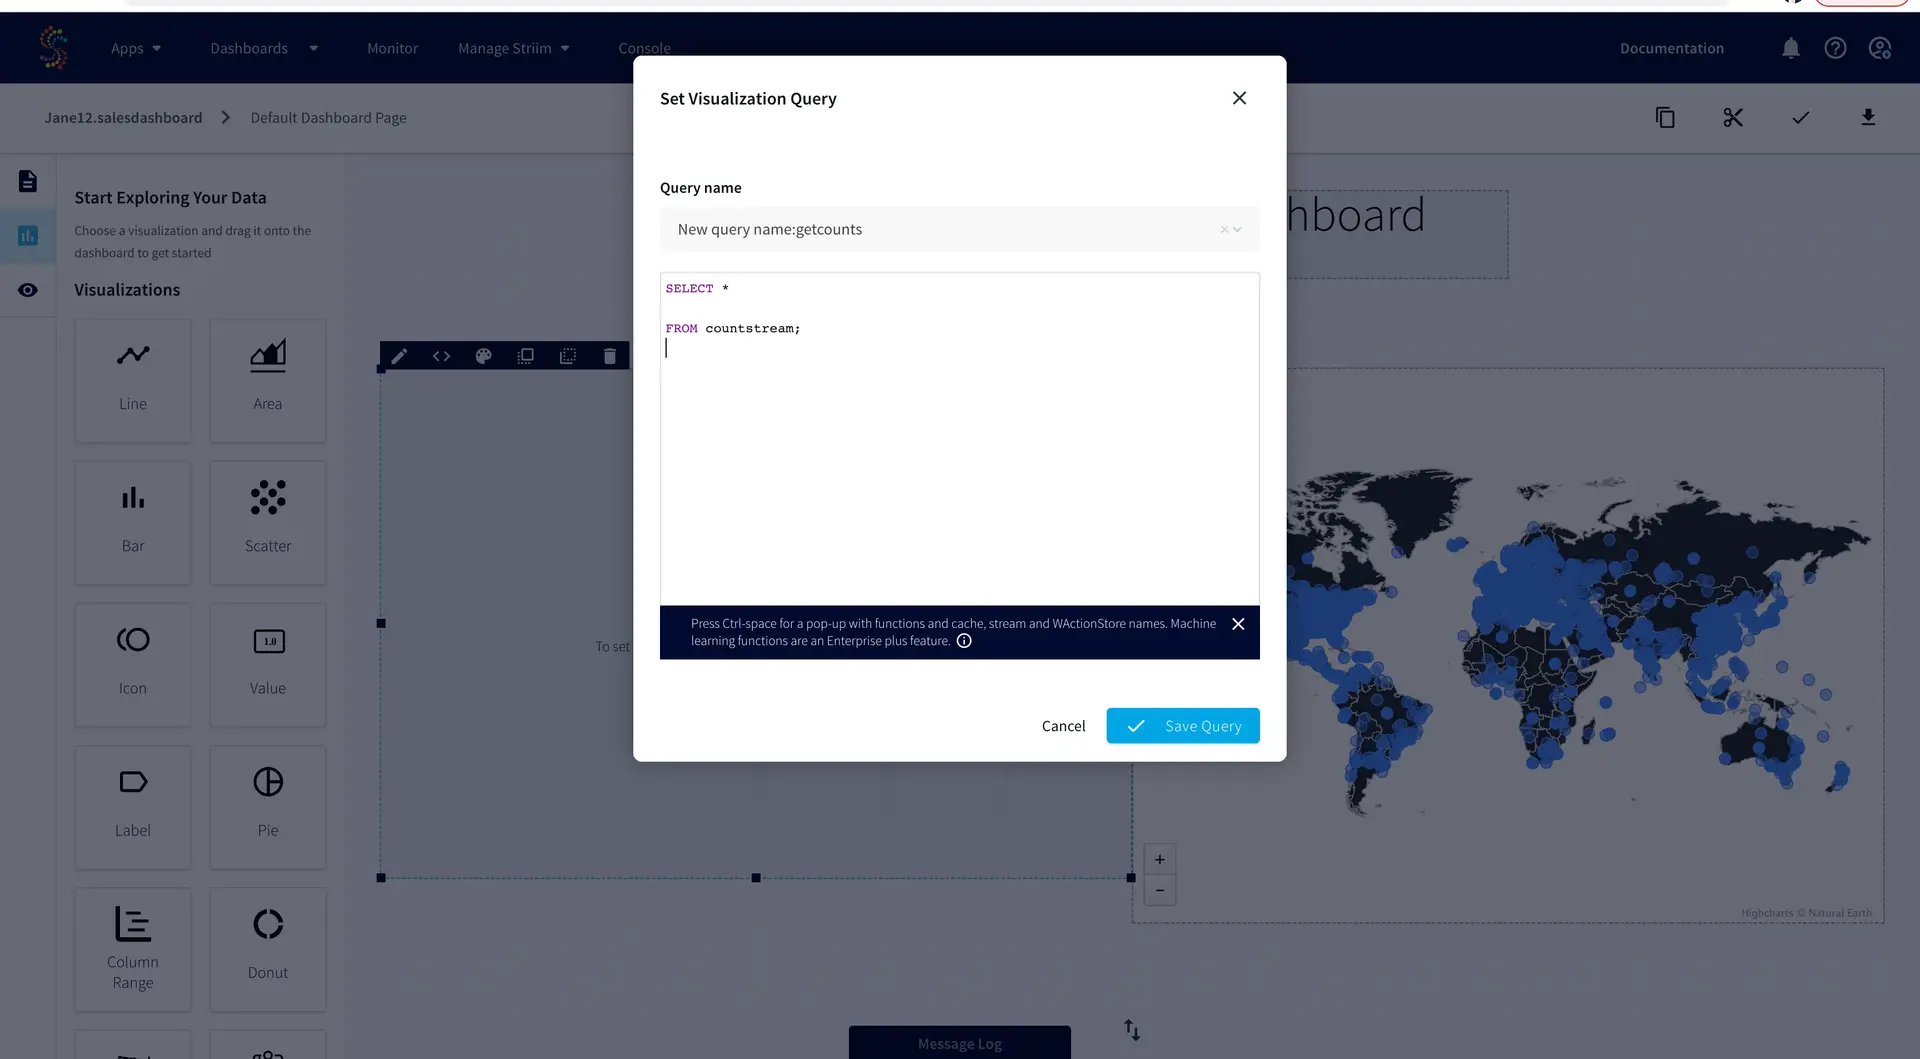
Name the query ‘getcounts’ or whatever you want (no whitespace or special characters) and push ‘Enter’ on your keyboard.
Enter the following query into the input
SELECT * FROM countstream;
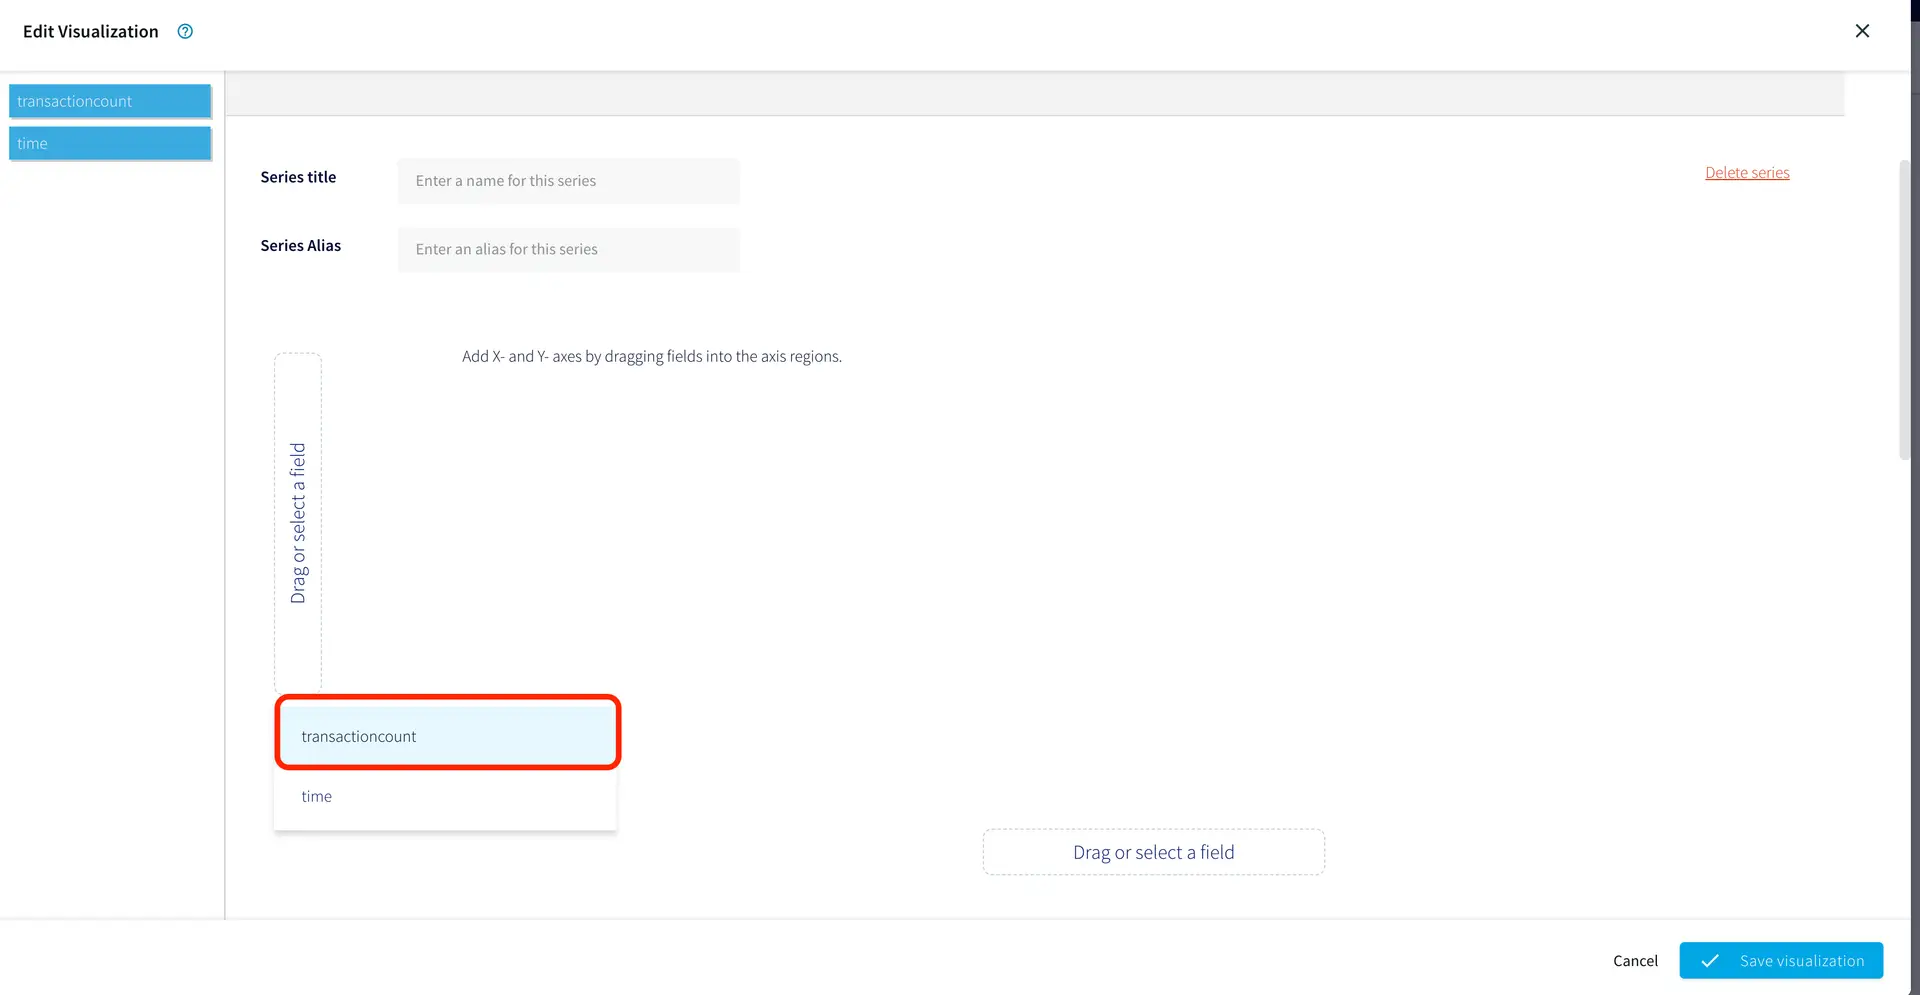
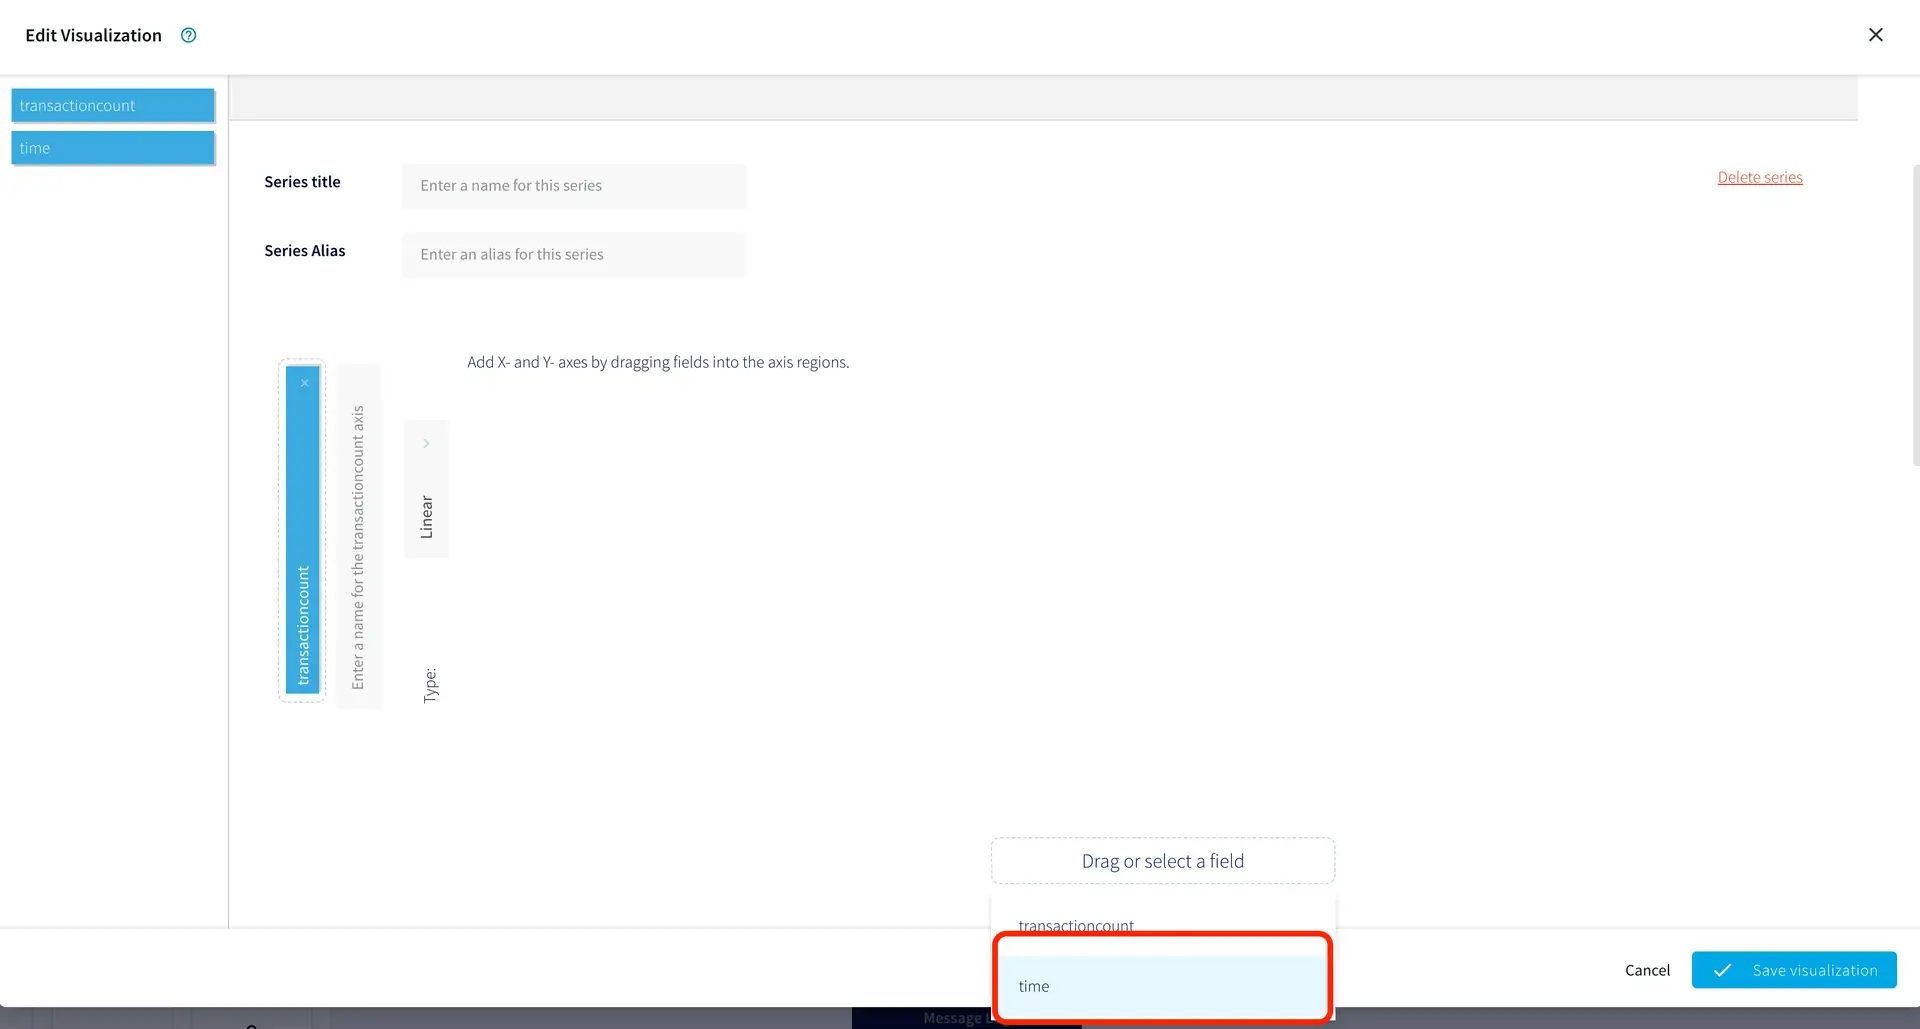
Click the ‘configure’ button as shown below to add axes details into your line graph. Choose ‘transactioncount’ field for y axis and ‘time’ with datetime format for x axis. For real-time chart, the data retention time is ‘current’.
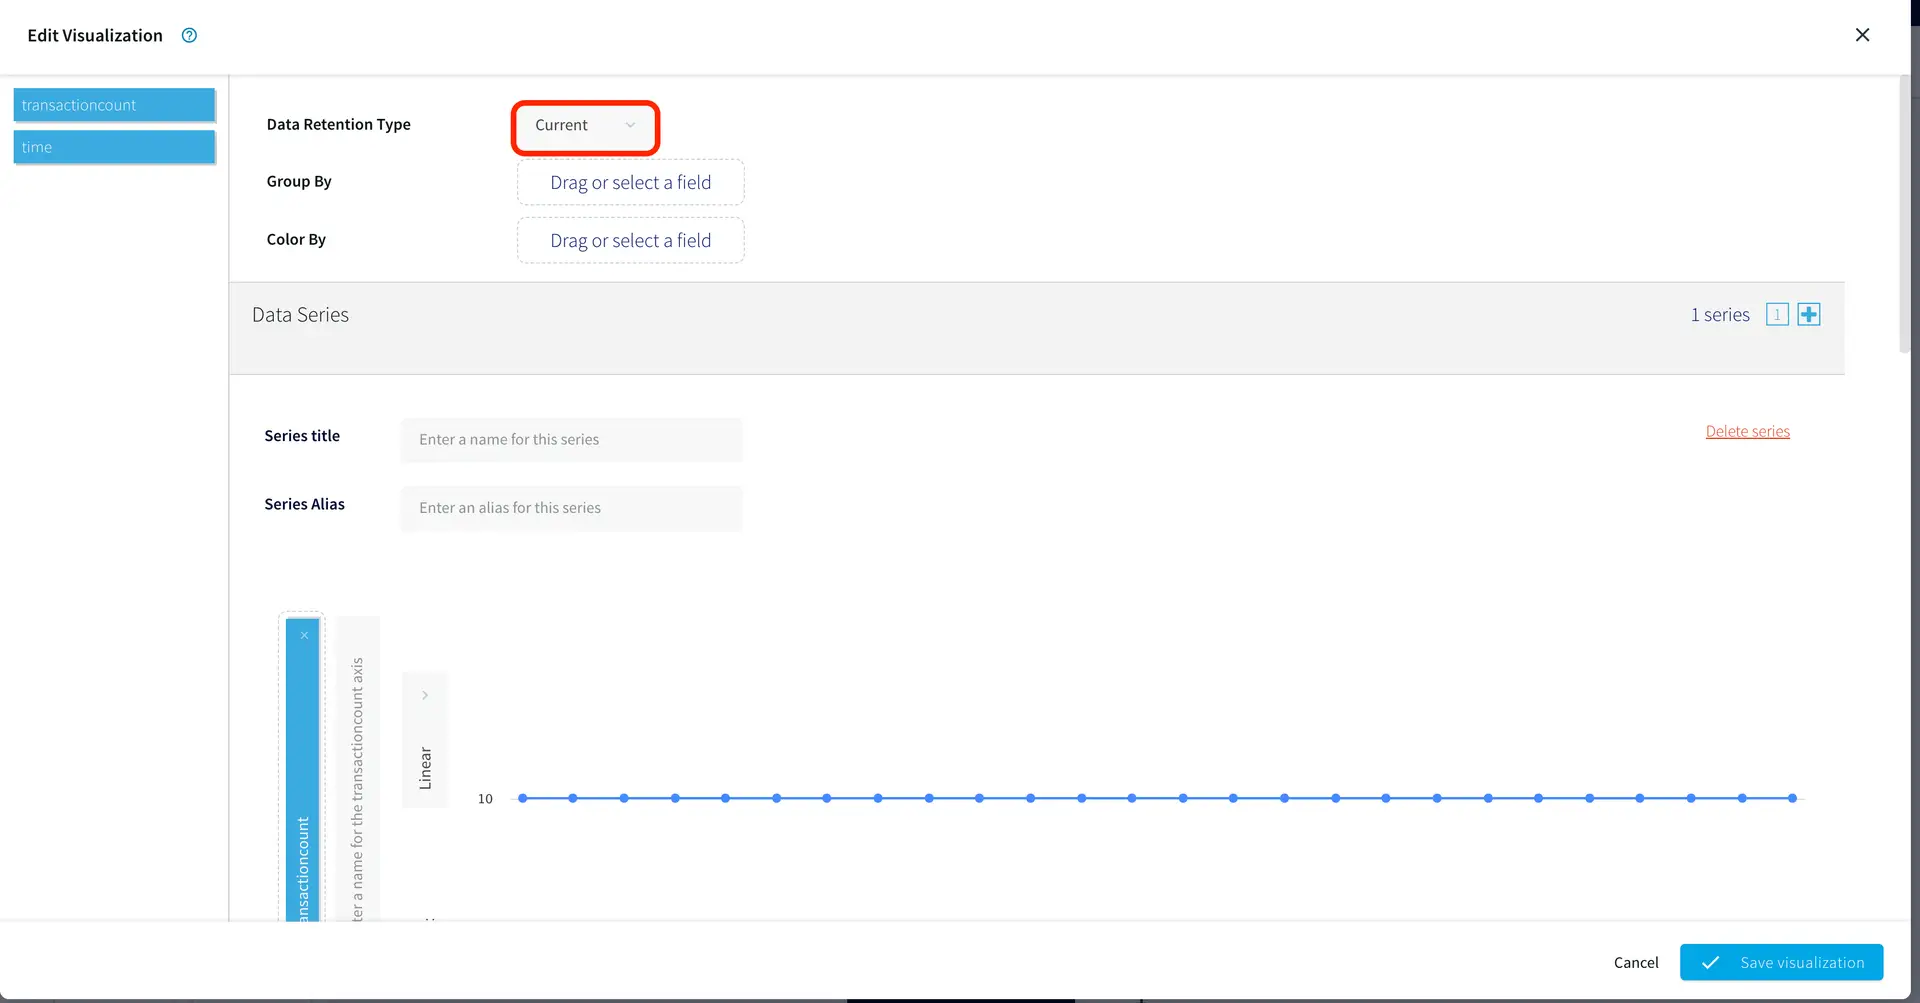
Now you have a real-time sales dashboard!
Striim
Striim’s unified data integration and streaming platform connects clouds, data and applications.