Tutorial
Ensure Data Freshness with Streaming SQL
Use Striim’s Streaming SQL to monitor and alert on lag between source and target systems
Benefits
Ensure Data Delivery SLAs
Monitor the data delivery in real-time to ensure it meets Service Level Agreement with your stakeholders
Simple Notifications in Email or Slack
Stream real-time alerts on stale data directly to your data teams via email or slack
Overview
Striim is a unified data streaming and integration product that offers change data capture (CDC) enabling continuous replication from popular databases such as Oracle, SQLServer, PostgreSQL and many others to target data warehouses like BigQuery and Snowflake. Data loses its value over time and to make the most out of it, real-time analytics is the modern solution. It is important for streaming pipelines to deliver real-time data with desired SLAs required for the target application.
In this application, the OP will monitor the target and generate an output stream with monitoring metrics, such as target table names, last merge time, and lag in minutes. These monitoring metrics can be used to trigger conditional flows based on business needs. In this case, we are using this to alert specific users or integrated Slack channels.The service level of this tool in terms of data freshness is in minutes and so it will only indicate the possibility of loss or delay in minutes.
The table monitoring application can be paired with any striim app with different targets. The coupled application will alert customers if their expected data rates are not being achieved on the target component of the Striim app. This way users can identify tables that are stale for analytics use cases and triage.
Core Striim Components
PostgreSQL CDC: PostgreSQL Reader uses the wal2json plugin to read PostgreSQL change data. 1.x releases of wal2jon can not read transactions larger than 1 GB.
BigQueryWriter: Striim’s BigQueryWriter writes the data from various supported sources into Google’s BigQuery data warehouse to support real time data warehousing and reporting.
Open Processor: A Striim open processor contains a custom Java application that reads data from a window or stream, processes it, optionally enriching it with data from a cache, and writes to an output stream.
Streaming App
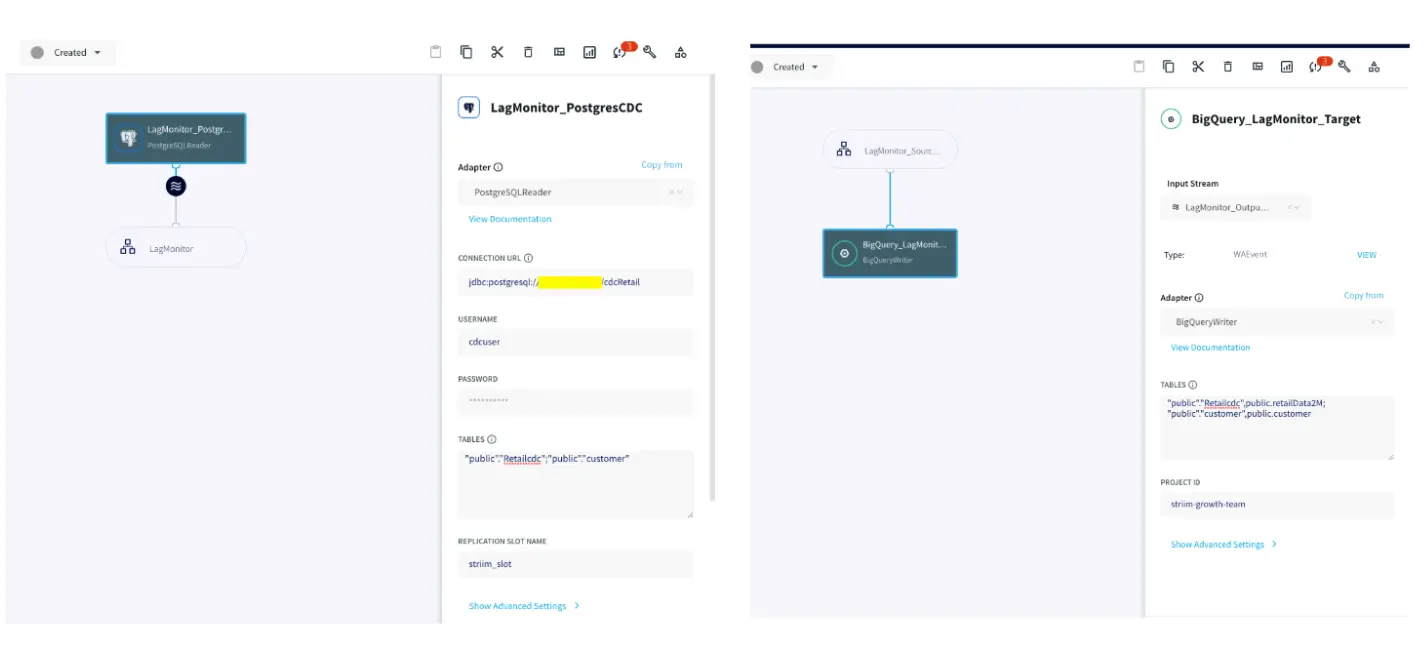
The utility tool can be paired with any Striim app with a variety of targets supported by Striim. For this recipe, our app replicates data from Postgres CDC to BigQuery. Please follow this recipe to learn how to set up a CDC user and configure Postgres CDC to BigQuery streaming application.
Monitoring Tables
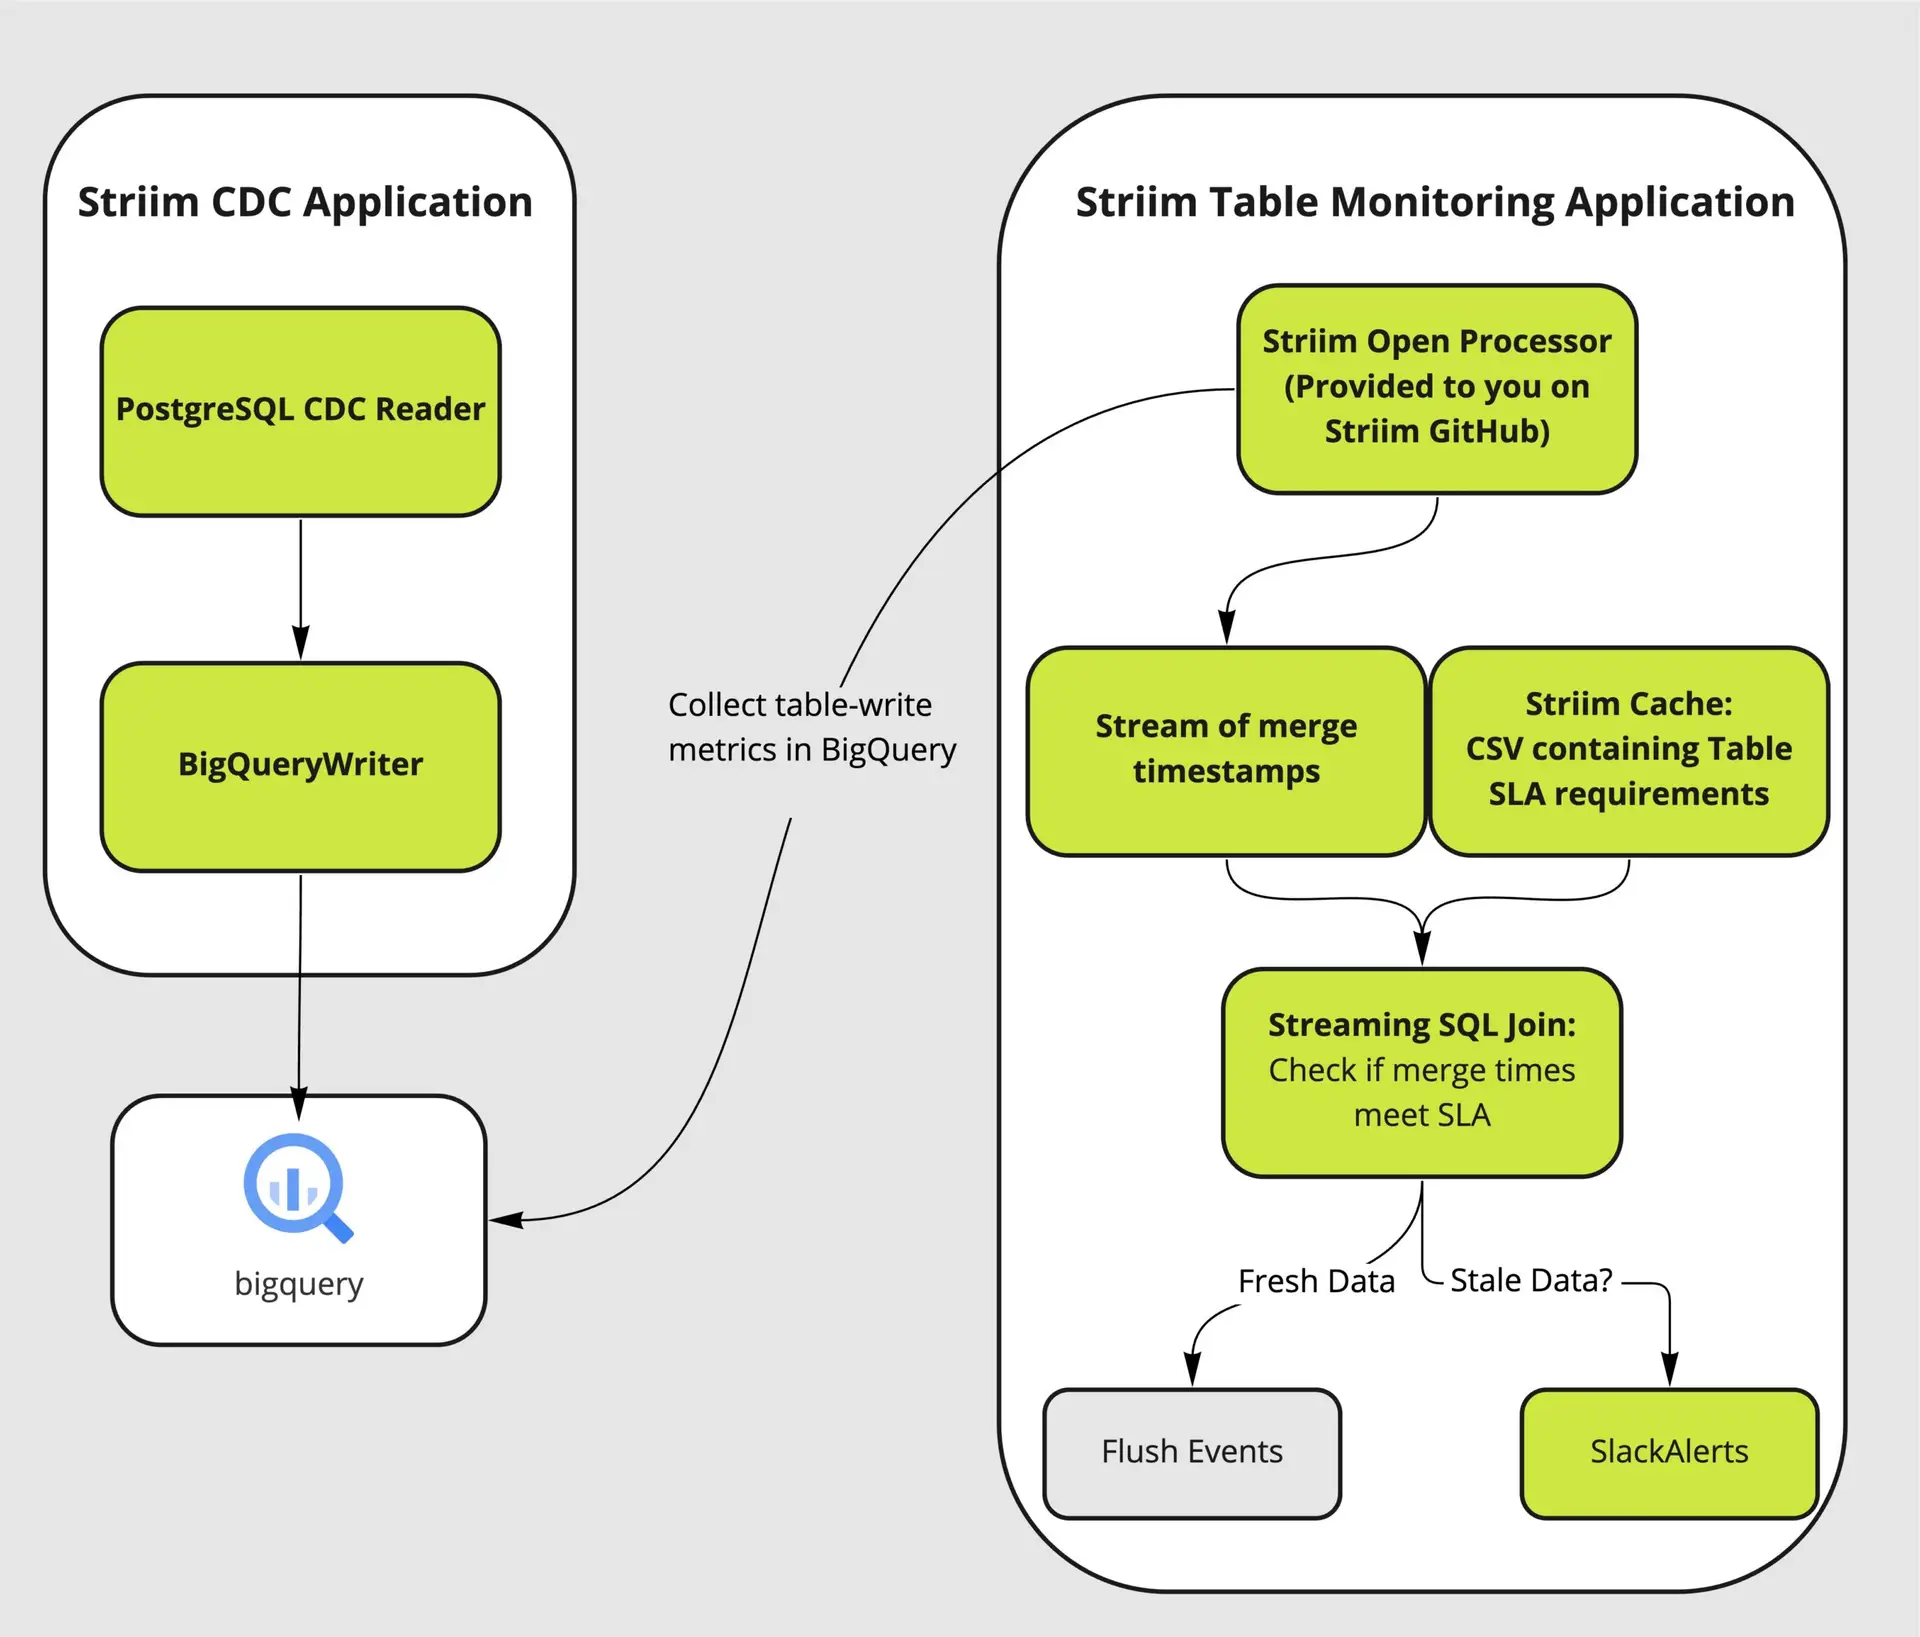
There are four major components of the utility tool that couples with the user’s streaming app to analyze and alert on database tables that are falling behind their data delivery SLA to respective targets.
A Trigger input stream invokes the monitoring Open Processor at specified time intervals. The Open Processor that contains a custom Java code will monitor the target component and emit monitoring metrics as stream for the next component (in this case, Continuous Query) in the application flow The Continuous Query component then compares the table lag condition (specified in the user-provided spreadsheet) with the monitoring metrics from the OP. Finally, mailer target component will send alerts when the SLA condition has not been met. The following functional diagram shows the architecture of the Table-level monitoring utility system.
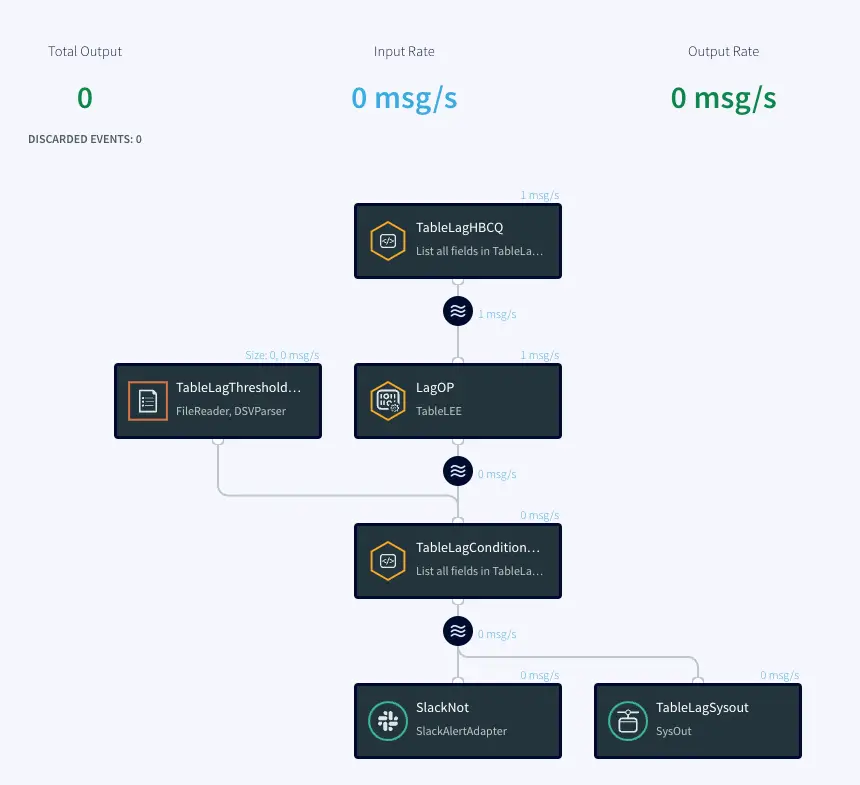
Here is the Striim Utility app that fetches data from target and compares it against a benchmark to ensure table SLAs. You can download the TQL file from our github repository.
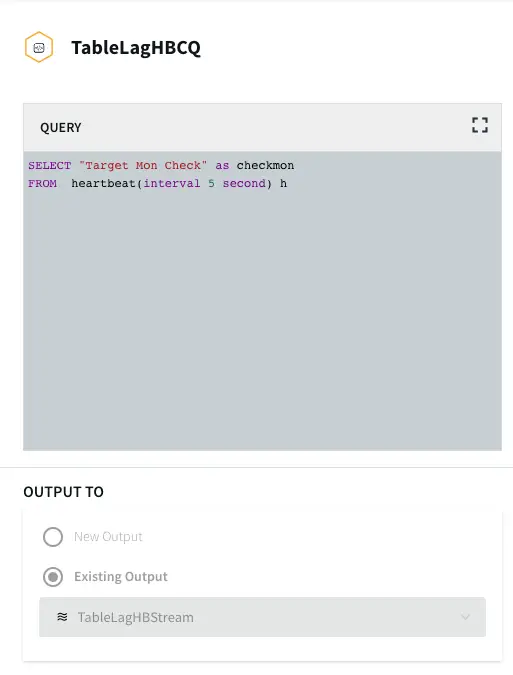
Trigger Input Stream
The Trigger input stream (TableLagHBCQ) passes a heartbeat (in this case 5 seconds) that acts as a trigger to allow the Open Processor to run its cycles periodically. This periodic time interval can be modified by the user.
Open Processor
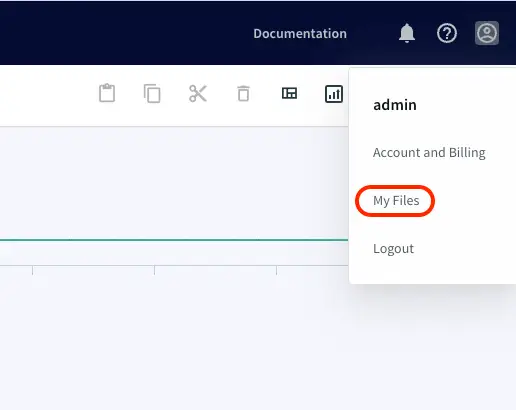
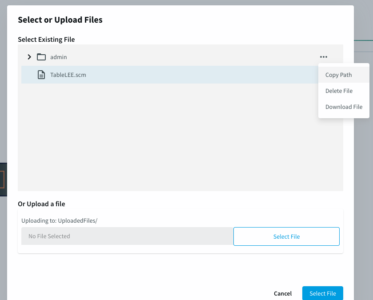
The OP component is the heart of this utility tool. It is designed by Striim’s engineering team for the purpose of table-level lag monitoring. It is in the form of a .scm file. Loading an Open Processor file requires a Global.admin role. Please reach out to cloud_support@striim.com to load the .scm file downloaded from our github repo. To upload the .scm file click on My files in the upper right corner and select the file from your local computer.
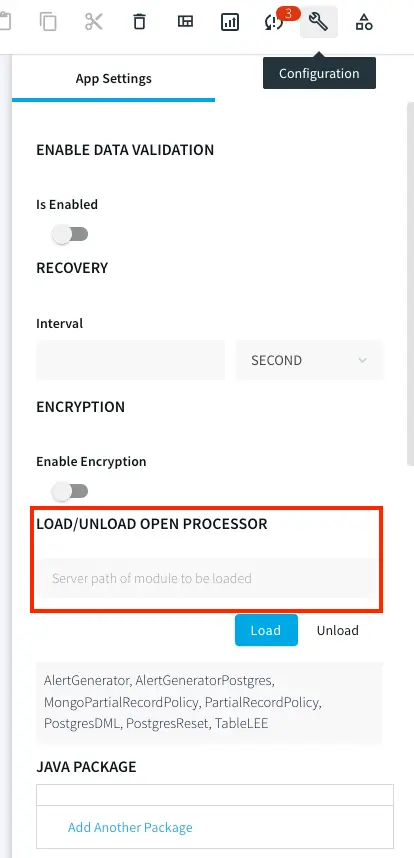
Once the file is uploaded, copy the file path and paste it into LOAD/UNLOAD OPEN PROCESSOR under Configuration -> App Settings as shown below:
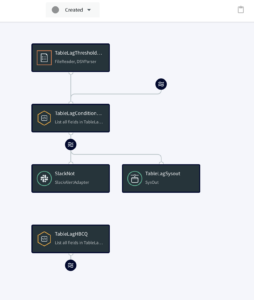
Next, the user needs to configure the Open Processor Component inside the TQL file downloaded from our github account. The TQL file from the git repo should ideally look like this:
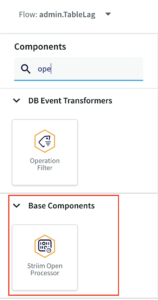
The user needs to add the OP component from the list of components in Striim:
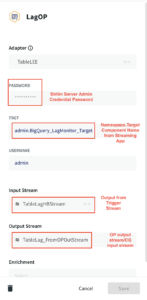
The configuration of OP component is shown below:
Lag Threshold CSV and Continuous Query
This part of the application reads from a csv file uploaded in the same way as the .scm file in the previous step that contains the list of Target Tables, lag threshold as per table SLAs and email in case of email adapter as the mailer alert. A sample file can be found in the github repository. The first column specifies all the table names that are monitored. The second column contains the SLA in minutes. The third column is used for email as mailer alert and can be skipped for slack alert.
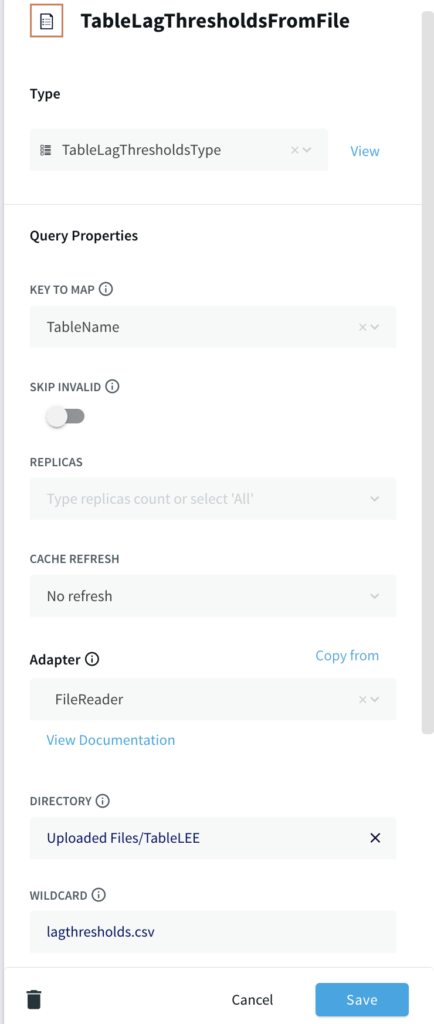
If you are setting up the app from scratch, use a File reader component and specify the file path with DSVParser as shown below:
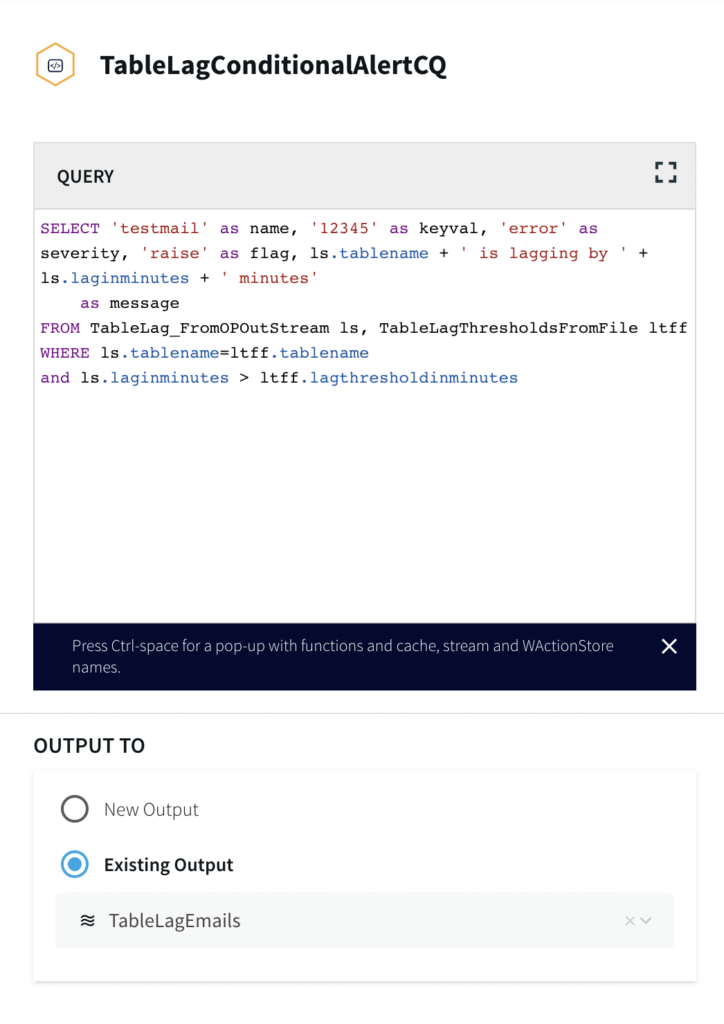
The Continuous Query has already been written for users in our tql file. It returns an alert message when the output lag time from the OP’s monitoring metrics is greater than the lag threshold specified by the user.
Slack Adapter as Mailer Target Component
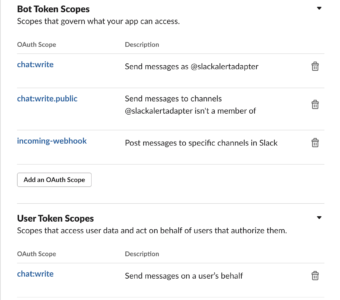
For this use case, we have configured a Slack target component. Please follow the steps in this link to configure slack to receive alerts from Striim. There is an additional Bot Token scope configuration for incoming-webhook. Please refer to the next image for scopes section.
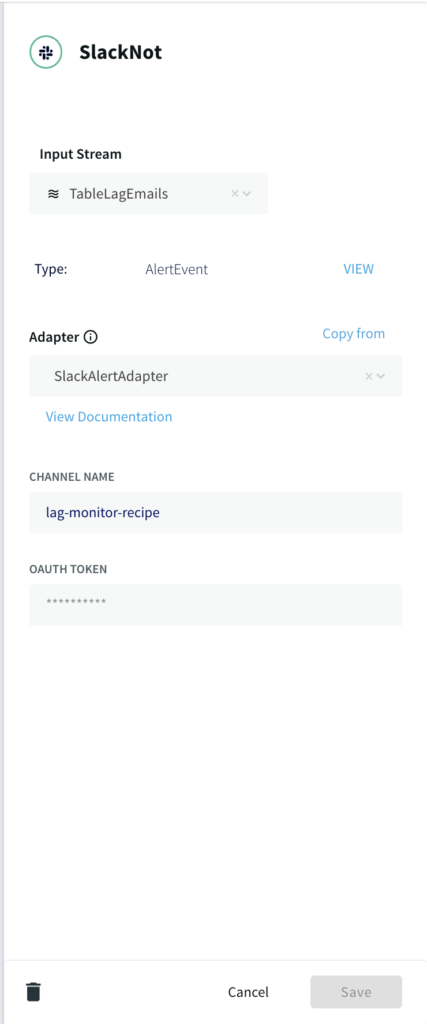
Configure the slack adapter with the channel name and oauth token as shown below:
Setting Up the Utility
Step 1: Download the TQL files
You can download the TQL files for streaming app and lag monitor app from our github repository. Deploy the lag monitor app on your Striim server.
Step 2: Set up the source and Target for streaming app
You can use any Striim app of your choice and monitor the data freshness. Please checkout our tutorials and recipes to learn how to set up streaming applications with various sources and targets.
Step 3: Edit the csv file
The first column of lagthreshold csv file lists the names of target tables that are monitored and second column contains the SLA in minutes. The third column is optional and is used in case of email alerts. Upload the csv file and enter the filepath in the FileReader component of your app as explained in ‘Lag Threshold CSV and Continuous Query’ section of this recipe
Step 4: Upload the .scm file
If you do not have Global.admin permission, please reach out to cloud_support@striim.com to upload the OP .scm script. Once the .scm file is uploaded, follow the steps in ‘Open Processor’ section of this recipe to configure the open processor component.
Step 5: Set up the Slack Channel
Configure a slack channel with correct Bot Token and User Token Scopes as explained above. You can follow this link to set up the slack alerts. Generate the oauth token for your channel and configure the slack mailer component of the lag monitor app.
Next, you are ready to monitor the data rates through slack alerts for your streaming app.
Running the Application
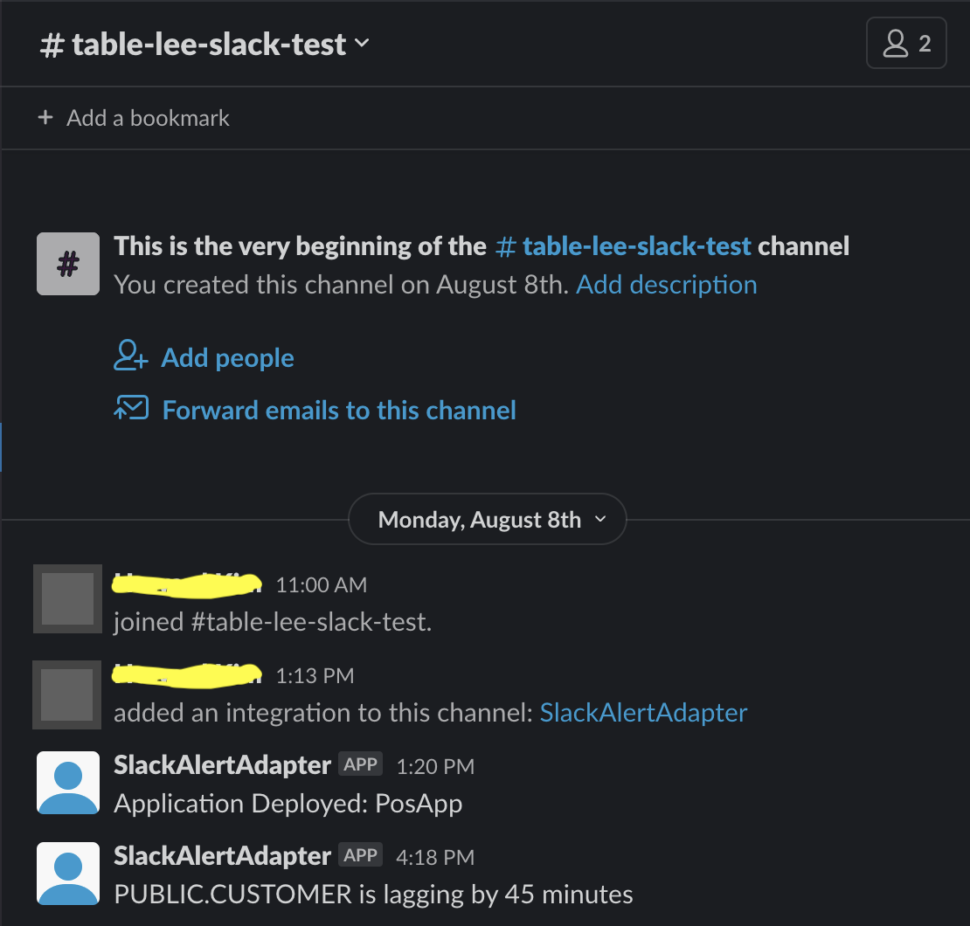
Next, deploy and run the lag monitor app. When the streaming app (Postgres to BQ) is deployed, run, quiesced, stopped, halted or crashed, OP will be able to retrieve Monitoring Report and Slack alerts will be sent through mailer components accordingly. Here is a sample Slack alert notification for a lagging table.
Wrapping Up: Start your Free Trial Today
Our tutorial showed you how a striim utility tool created with an Open Processor component can help customers monitor table SLAs. The Slack alerts make it very easy to track data delivery rate and take action immediately in case of delays.
As always, feel free to reach out to our integration experts to schedule a demo, or try Striim for free here.
Tools you need

Striim
Striim’s unified data integration and streaming platform connects clouds, data and applications.

PostgreSQL
PostgreSQL is an open-source relational database management system.

Google BigQuery
BigQuery is a serverless, highly scalable multicloud data warehouse.


