


Why consider streaming analytics? Because analysts deserve a quiet lunch, too.
“Cause you’re working
Building a mystery
Holding on and holding it in
Yeah you’re working
Building a mystery
And choosing so carefully”
– Sarah McLachlan
Every so often in the life of an SOC analyst, there are moments of perfect clarity. These do not always come from behind a desk, nor in front of a computer screen. Sometimes it’s the perfect afternoon, with the scent of spring in the air; a table in the less crowded section of the lunch room; a perfectly seasoned Italian sandwich with just enough red wine vinegar to know it’s there, but not so much that it soaks the roll and ends up on your shirt. It’s during these moments that people who wear ties tend to notice the serene waters of the afternoon and come rushing in on their Zodiac boats, splashing water all over your moment like a can of LeCroix that saw one too many bumps during your daily commute.
“It seems that there have been some disturbances with one of the servers in the production environment,” The Tie says. Suddenly, and for no clear reason, logs were cropping up with people named “Pi” and “Public,” trying to log in to one of our corporate servers. The Tie asked me most politely to set aside my respite and have a look at what was going on. My love for a good lunch hour was surpassed by a momentary flashback to the movie Hackers when the most common passwords were discussed. With a smile, I told The Tie I would gladly look into this. The Tie smiled that smile from Office Space, and went on his way.
Moments later, in the basement, I sat down and opened a fresh caffeination cylinder and a playlist of Sarah McLachlan songs, and dug in. The first stop was to look at the auth.log file for the server that had been under attack.
Apr  8 08:19:45 ip-123-45-6-7 sshd[19131]: input_userauth_request: invalid user postgres [preauth]

Apr  8 08:19:45 ip-123-45-6-7 sshd[19131]: Received disconnect from 128.199.35.247 port 41158:11: Normal Shutdown, Thank you for playing [preauth]

Apr  8 08:19:45 ip-123-45-6-7 sshd[19131]: Disconnected from 128.199.35.247 port 41158 [preauth]

Apr  8 08:19:57 ip-123-45-6-7 sshd[19133]: Invalid user test from 183.6.189.164

Apr  8 08:19:57 ip-123-45-6-7 sshd[19133]: input_userauth_request: invalid user test [preauth]

Apr  8 08:19:57 ip-123-45-6-7 sshd[19133]: Connection closed by 183.6.189.164 port 53513 [preauth]

Apr  8 08:22:37 ip-123-45-6-7 sshd[19135]: Invalid user ftpuser from 118.45.190.133

Apr  8 08:22:37 ip-123-45-6-7 sshd[19135]: input_userauth_request: invalid user ftpuser [preauth]

Apr  8 08:22:37 ip-123-45-6-7 sshd[19135]: Received disconnect from 118.45.190.133 port 40520:11: Normal Shutdown, Thank you for playing [preauth]
From the looks of this it would seem that someone was trying the old dictionary attack attempting to log in to the server. Many people wonder why these attacks still happen. The simple answer is that they still work. If people did not leave themselves open to attacks like this, Shodan would be nothing more than a rank in the game Go. Still, even with solid gates, multi-factor authentication and security analysts protecting networks, there is no excuse for allowing people to just hammer on the walls. One never knows where they might find a foothold. It was time to start playing the role of analyst.
The best approach to this would be to use streaming analytics, so that we could capture the past and the future attempts in real time for immediate as well as long term analysis. My first step was to create a new Striim application to gather this data from the server, and prepare it for automated processing. With a deep breath, the TQL started to flow.
-- LOCAL AUTH LOG

-- Set workspace  and import JAVA tools needed


CREATE APPLICATION locallogs;

IMPORT static NSLookup.*;

-- Create flow for intake of the log file

-- Source : /var/log/auth.log


CREATE FLOW logflow;

CREATE SOURCE raw_auth_log USING FileReader (

    wildcard:'auth.log',

    skipbom:true,

    directory:'/var/log',

    blocksize:64,

    rolloverstyle: 'Default',

    includesubdirectories: false,

    adapterName: 'FileReader',

    positionbyeof: false

)


  PARSE USING FreeFormTextParser (

    blockascompleterecord: false,

    parserName: 'FreeFormTextParser',

    charset: 'UTF-8',

    RecordBegin: 'n',

    ignoremultiplerecordbegin: 'true',

    separator: '~',

    handler: 'com.webaction.proc.FreeFormTextParser_1_0'

)


OUTPUT TO FLOW_RAW_AUTH;

END FLOW logflow;
Next, I needed to normalize and parse these log entries. To do this effectively would take two steps. First, getting the log into its component parts, and then down to specific events for analysis.
To accomplish the first part:
CREATE FLOW parselogs;

-- Crate type for auth Logs

CREATE TYPE AuthLogType

(

    _LOGSERVERTIMESTAMP String,

    _LSTS             DateTime,

    _LOGSOURCE          String,

    _SERVICEPID         String,

    _MESSAGE            String

);

-- Parse AUTH log

CREATE STREAM AUTH_LOG_STREAM OF AuthLogType;

CREATE OR REPLACE CQ CQ_PARSE_AUTH_LOG

INSERT INTO AUTH_LOG_STREAM

SELECT

MATCH(DATA[0],'n(w{3}s+d{1,2} d{2}:d{2}:d{2})') AS _LOGSERVERTIMESTAMP,

CASE

WHEN MATCH(_LOGSERVERTIMESTAMP,'.{3}  ',0) IS NOT NULL THEN TO_DATE(_LOGSERVERTIMESTAMP,"MMM  dd HH:mm:ss")

ELSE

TO_DATE(_LOGSERVERTIMESTAMP,"MMM dd HH:mm:ss")

END as _LSTS,

MATCH(DATA[0],':d{2} (.+?) ') AS _LOGSOURCE,

MATCH(DATA[0],':d{2} .+? (.+?): ') AS _SERVICEPID,

MATCH(DATA[0],': (.+?)$') AS _MESSAGE

FROM FLOW_RAW_AUTH;

END FLOW parselogs;
This would successfully partition the data and ensure that the next step would be easier to accomplish. Next, we had to determine what we had in our hands. The Tie had mentioned that they had noticed invalid users, so that was a good place to start. Reviewing the log, it was clear how these attempts were captured. Although an invalid user created two log entries, one had more information than the other, and could easily be separated from the rest.
Apr 10 02:35:45 ip-10-99-11-243 sshd[8377]: Invalid user test from 202.131.152.2

Apr 10 02:35:45 ip-10-99-11-243 sshd[8377]: input_userauth_request: invalid user test [preauth]

Apr 10 02:48:07 ip-10-99-11-243 sshd[8624]: Invalid user sysadmin from 113.193.26.229

Apr 10 02:48:07 ip-10-99-11-243 sshd[8624]: input_userauth_request: invalid user sysadmin [preauth]
The entries that contained the invalid user id and the source IP address contained the string “Invalid user,” so I could capture those by the capital letter I and not pay attention to the other message with less info. This may seem like a small thing, however when you start working with large amounts of data, everything you can exclude saves you processing time and storage space.
The next step would be to refine the data. The data we are most interested in at the moment is now contained in _MESSAGE. From there we can make a query against our streaming data to extract the invalid user id, and the IP address from which the login request came from. It was time to create a stream that contained this data:
CREATE FLOW analize_logs;


CREATE TYPE InvalidUserType

(

    _MESSAGE            String,

    _LSTS             DateTime,

    _USERID             String,

    _IPADDRESS          String


);


CREATE WACTIONSTORE WA_INVALID_USERS CONTEXT OF InvalidUserType;


CREATE CQ CQ_INVALID_USER

INSERT INTO INVALID_USER_STREAM

SELECT

_MESSAGE, _LSTS,


MATCH(_MESSAGE,'Invalid user (.+?) from',1) AS _USERID,

MATCH(_MESSAGE,'Invalid user .+? from (.+?)$',1) AS _IPADDRESS


FROM AUTH_LOG_STREAM WHERE _MESSAGE LIKE '%Invalid user%';


END FLOW analize_logs;
So with that query in place, I jumped over to my console to ensure that my results were what I was after:
 > SELECT * FROM WA_INVALID_USERS;

Processing - SELECT * FROM WA_INVALID_USERS

[

   _MESSAGE = Invalid user play from 121.33.238.218

   _LSTS = 2000-04-08T06:34:52.000Z

   _USERID = play

   _IPADDRESS = 121.33.238.218

]

[

   _MESSAGE = Invalid user oracle from 54.37.224.232

   _LSTS = 2000-04-08T06:58:59.000Z

   _USERID = oracle

   _IPADDRESS = 54.37.224.232

]
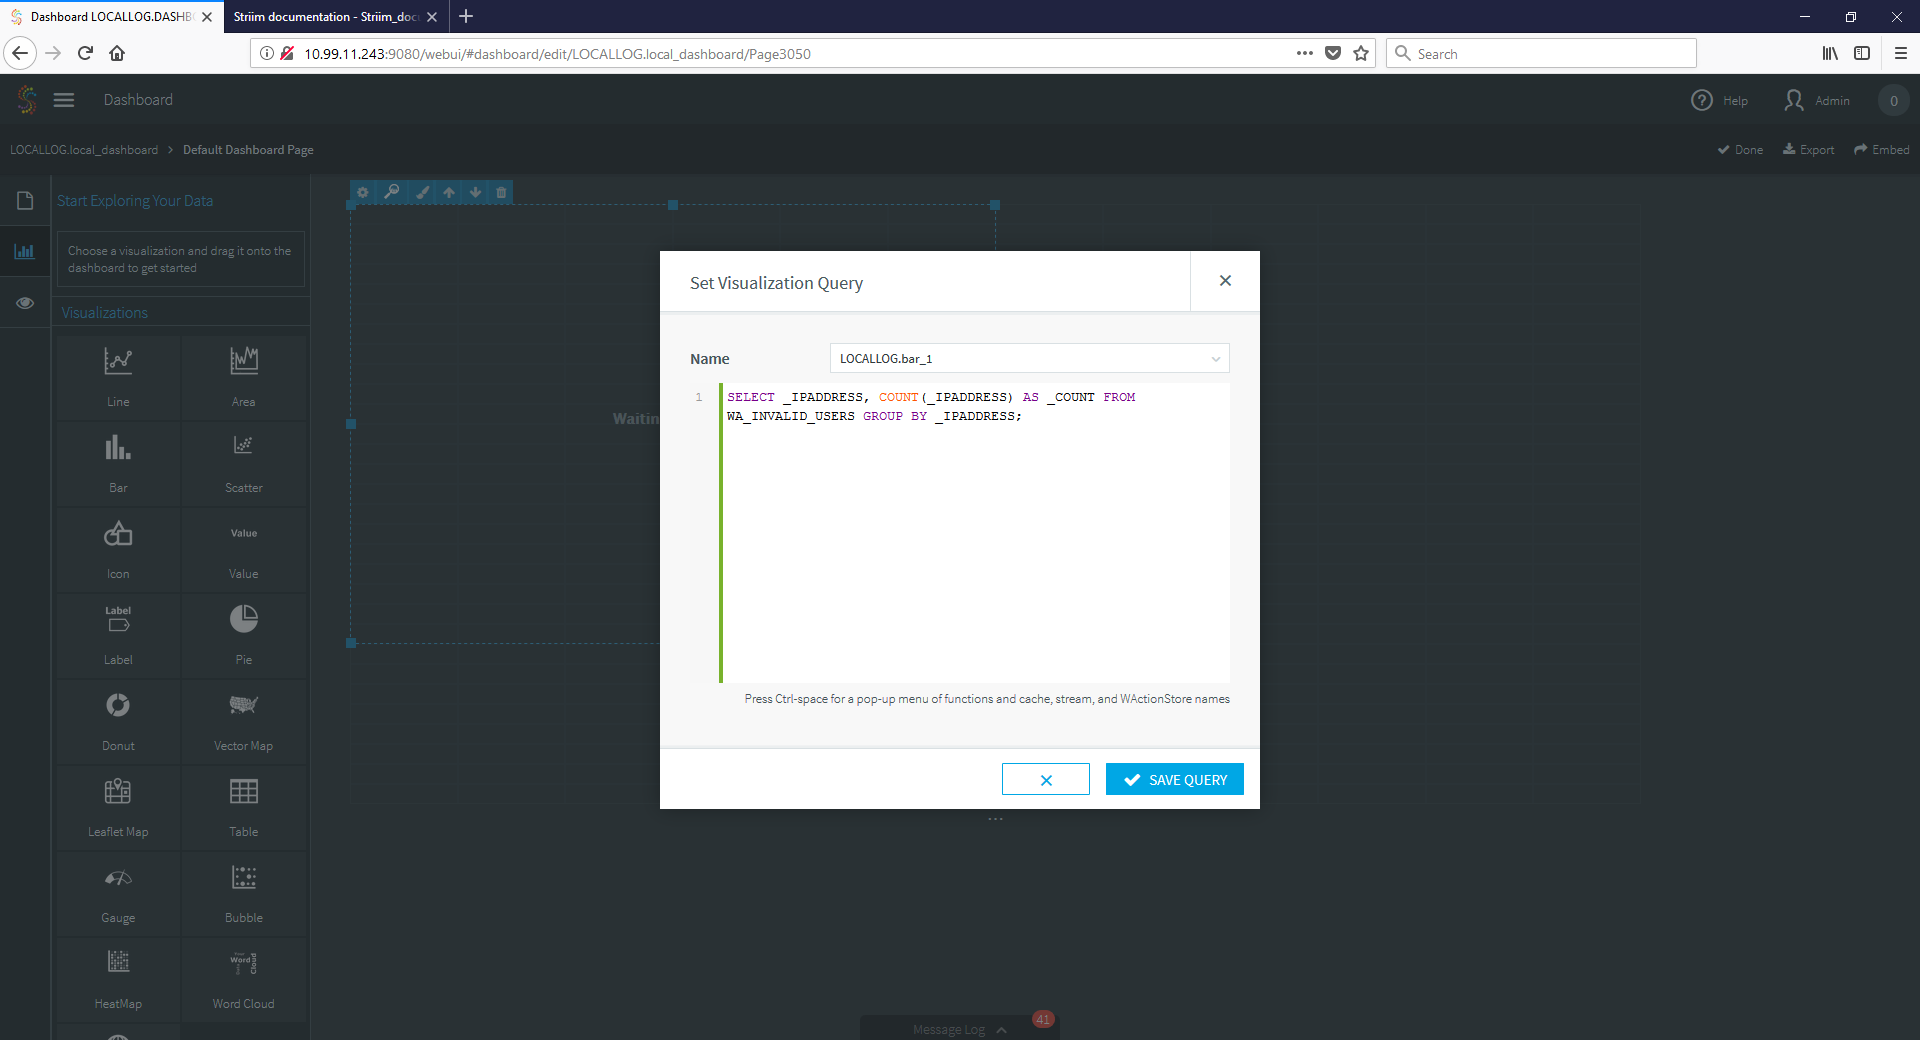
So far, so good. The next step would be to gather the data in a meaningful way and enrich it. This is simple, with a few queries. A short pause for knuckle cracking and it was done. A quick dashboard query showed us some useful data about the IP addresses attacking:
And, as expected, there was quite a bit of activity, and some good intelligence to be had:
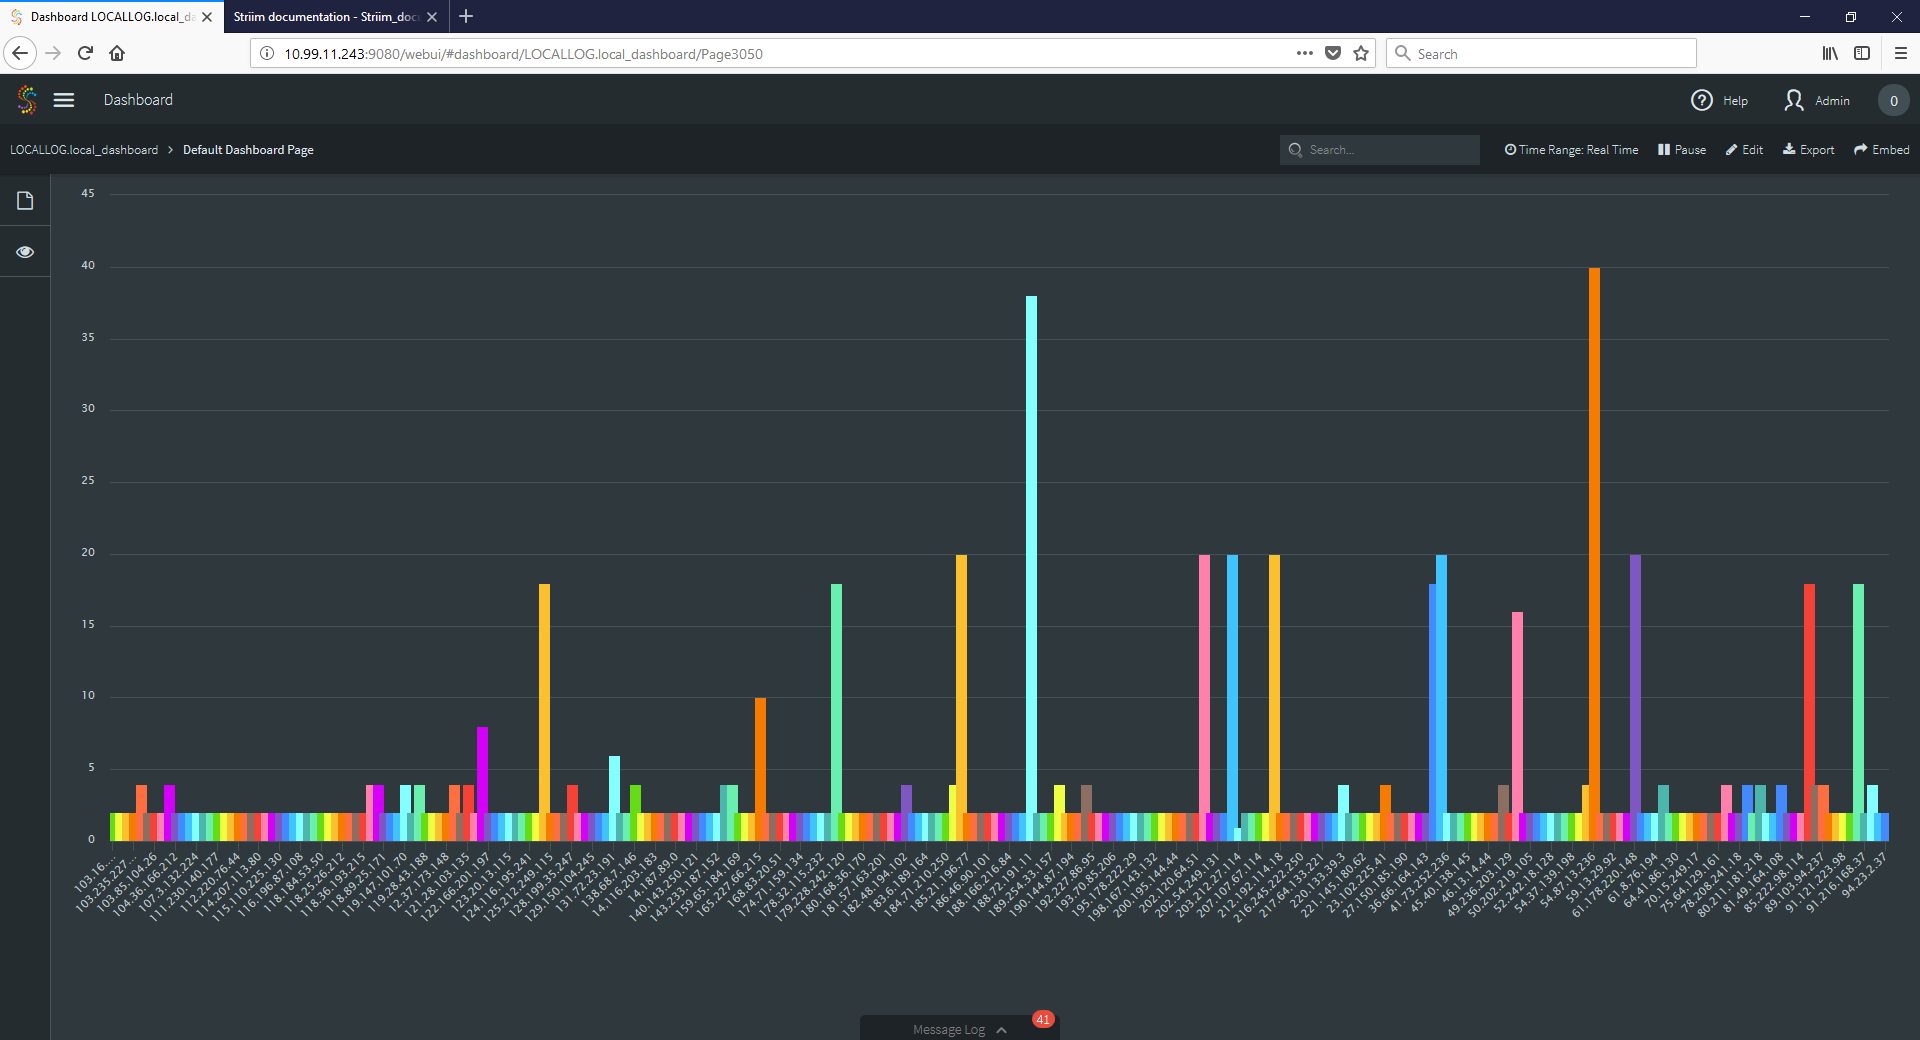
So what have we here? It seems a large number of IP addresses each trying exactly twice, a few trying exactly 20 times, and two very persistent with nearly 40 tries in our sample. It seems clear that we had attracted the attention of some script kiddies. One thing seemed odd though – why did The Tie just now notice this? Let’s take a look at it from another angle…
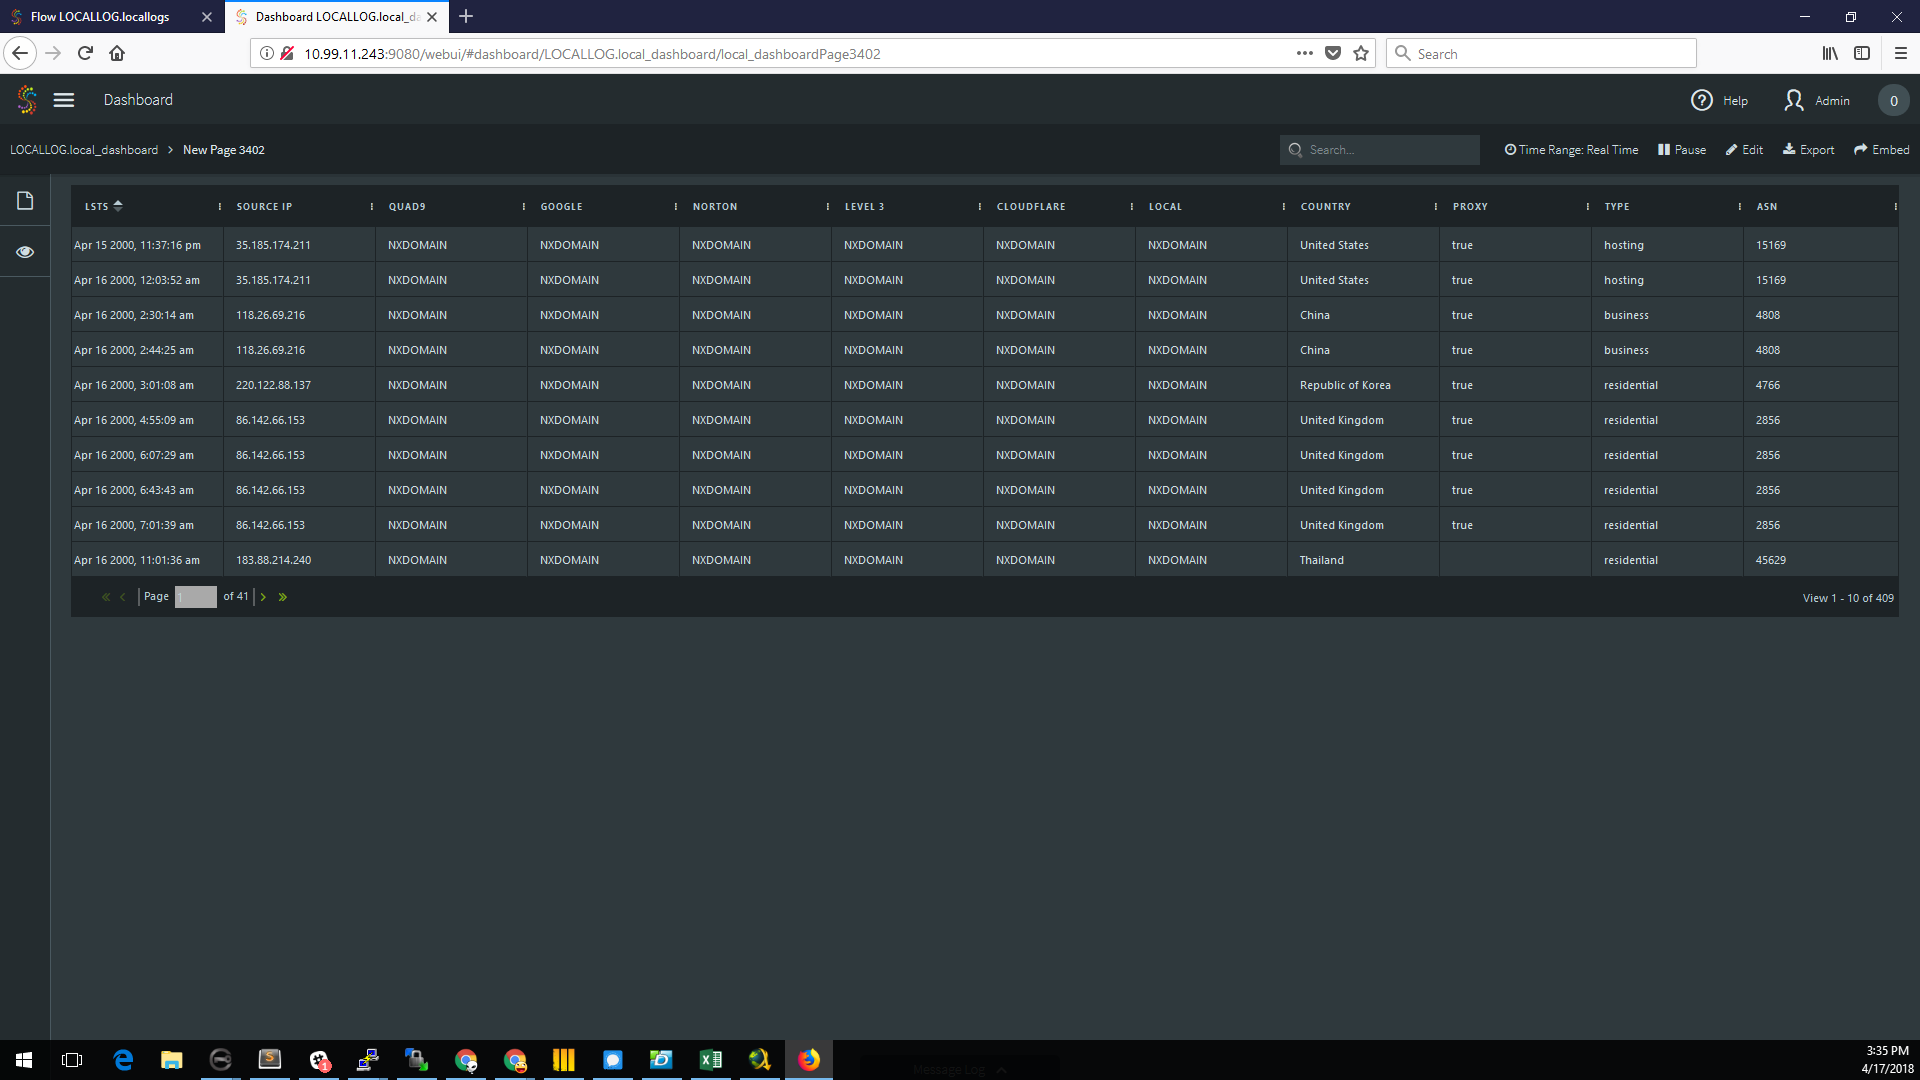
A quick review of the offending IP addresses, and enrichment by looking them up in the Maxmind database, it appeared that they were mostly proxies, and from a handful of countries. Once again, the streaming analytics could have saved the day if they had been in place all along. I quickly added these queries and dashboards to the security system, and in doing so I noticed one extra bit of information: the attacks lasted only two days. There was not a trace of them before or after a two-day window. I took this to The Tie, and asked him to compare it against our change control system.
Sure enough, what had happened was that during an update of our AWS environment, someone had made a change to a security group during a ‘testing’ phase, and opened the gates to 0.0.0.0 (anyone). This was spotted and corrected, and noted in the change control documentation. The rest was history. Constant scans against known address space were present and just waiting for an opportunity to open. Thankfully, our well established defense in depth policies (key based logins, change control, logging, removal of default user ID / password combinations, etc… BOFH stuff) prevented any incursion. For good measure, however, I took my newly formed queries and dashboards and updated our log review policy and procedure to ensure that the real time streaming data was going to be analyzed from now on, complete with alarms and access to our paging tree. Streaming analytics had once again saved the day. After finishing my report, I took a deep breath and decided that after a successful day it was time to make my way home, where the most complex system I had to deal with was my cat.
The next morning when I came into my office, I was greeted with a sight that would humble and bring a tear to the eye of any analyst. On my desk was a memo from The Tie, stating what I had found and lecturing the dev ops team about opening up security groups to the world. Underneath the memo was a six pack of Mexican Coke in tall green glass bottles. A post it note attached said “With my compliments,” and it was signed by The Tie.
Questions? Comments? Suggestions for a topic to take on? Send them on to frankc@striim.com and you may find yourself spending an afternoon in The Analyst’s Shack.