Recent studies highlight the critical role of data in business success and the challenges organizations face in leveraging it effectively. A 2023 Salesforce study revealed that 80% of business leaders consider data essential for decision-making. However, a Seagate report found that 68% of available enterprise data goes unleveraged, signaling significant untapped potential for operational analytics to transform raw data into actionable insights.
Operational analytics unlocks valuable insights by embedding directly into core business functions. It leverages automation to streamline processes and reduce reliance on data specialists. Here’s why operational analytics is key to improving your organizational efficiency — and how to begin.
What Is Operational Analytics?
Operational analytics, a subset of business analytics, focuses on improving and optimizing daily operations within an organization. While business intelligence (BI) typically centers on the “big picture” — such as long-term trends, strategic planning, and organizational goals — operational analytics is about the “small picture.” It hones in on the granular, day-to-day decisions that collectively drive efficiency and effectiveness in real-time environments.
For example, consider a hospital seeking to streamline operations. To do so, the team would answer questions including:
- How many nurses are required per shift?
- How long should it take to transfer a patient to the ICU?
- How can patient wait times be reduced?
Operational analytics can answer these questions by providing actionable insights that drive efficiency and throughput. By analyzing real-time data, it helps organizations make data-informed decisions that directly improve daily workflows and overall performance.
Here’s another example: A customer service team can monitor ticket volumes in real-time, allowing them to prioritize responses without switching between tools. Similarly, a logistics coordinator can dynamically adjust delivery routes based on current traffic or weather conditions, ensuring smoother operations and greater agility. These examples illustrate how operational analytics seamlessly integrates into everyday processes, enabling teams to respond quickly and effectively to changing circumstances.
Operational analytics also excels in providing real-time feedback loops that BI does not typically offer. Where BI might analyze the success of a marketing campaign after its conclusion, operational analytics can inform ongoing campaigns by highlighting immediate trends, such as engagement spikes or content underperformance, enabling in-the-moment adjustments.
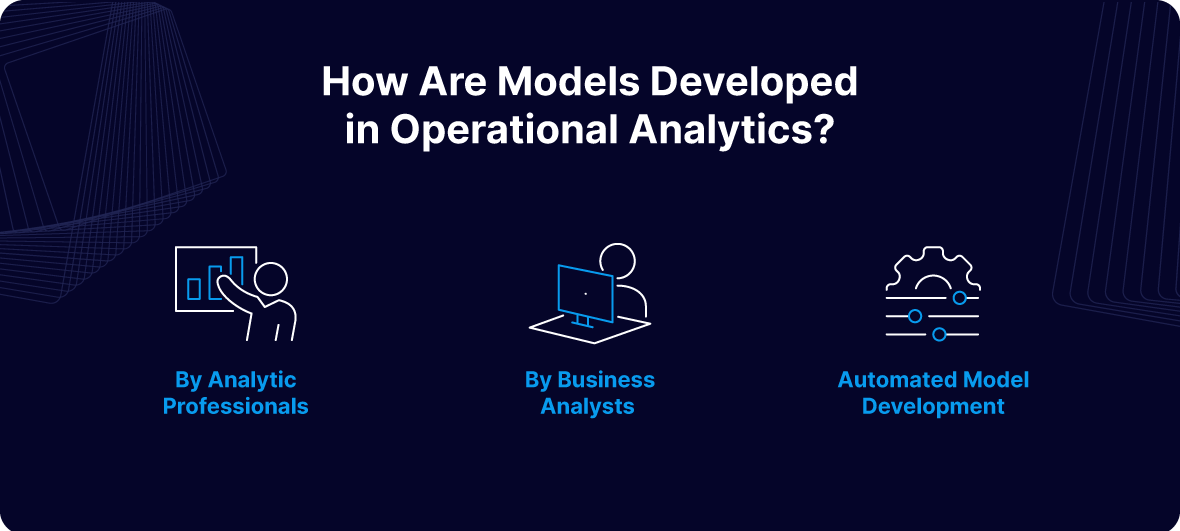
How Are Models Developed in Operational Analytics?
Analytic models are the backbone of operational analytics, helping organizations understand data, generate predictions, and make informed business decisions. There are three primary approaches to building models in operational analytics:
1. Model Development by Analytic Professionals
Analytic specialists, such as data scientists or statisticians, frequently lead the development of sophisticated models. They utilize advanced techniques including cluster analysis, cohort analysis, and regression analysis to uncover patterns and insights.
Models developed by these professionals generally follow one of the following approaches:
- Specialized Modeling Tools: Tools designed for tasks like data access, cleaning, aggregation, and analysis.
- Scripting Languages: Languages like Python and R that provide robust libraries for statistical and quantitative analysis.
As a result, this approach delivers highly customized and precise models but requires significant expertise in both statistics and programming.
2. Model Development by Business Analysts
For organizations with limited needs, hiring an analytic specialist may not be feasible. Instead, these teams can leverage business analysts who bring a combination of business understanding and familiarity with data.
Typically a business analyst:
- Understands operational workflows and data collection processes.
- Leverages BI tools for reporting and basic analytics.
While they may lack the technical depth of data scientists, business analysts use tools like Power BI and Tableau, which provide built-in functionalities and automation for model building. These tools allow them to extract and analyze data without the need for advanced programming knowledge, striking a balance between ease of use and analytical capability. Therefore, this is a great option for businesses that don’t have the resources to tap analytic professionals.
3. Automated Model Development
Automated model development leverages software to build models with minimal human intervention. This approach involves:
- Defining decision constraints and objectives.
- Using the software to experiment with different approaches for various customer scenarios.
- Allowing the software to learn from results over time to refine and optimize the model.
Through experimentation, the software identifies the most effective strategies, ultimately creating a model that adapts to customer preferences and operational needs. This method is particularly valuable for scaling analytics and reducing reliance on specialized skills.
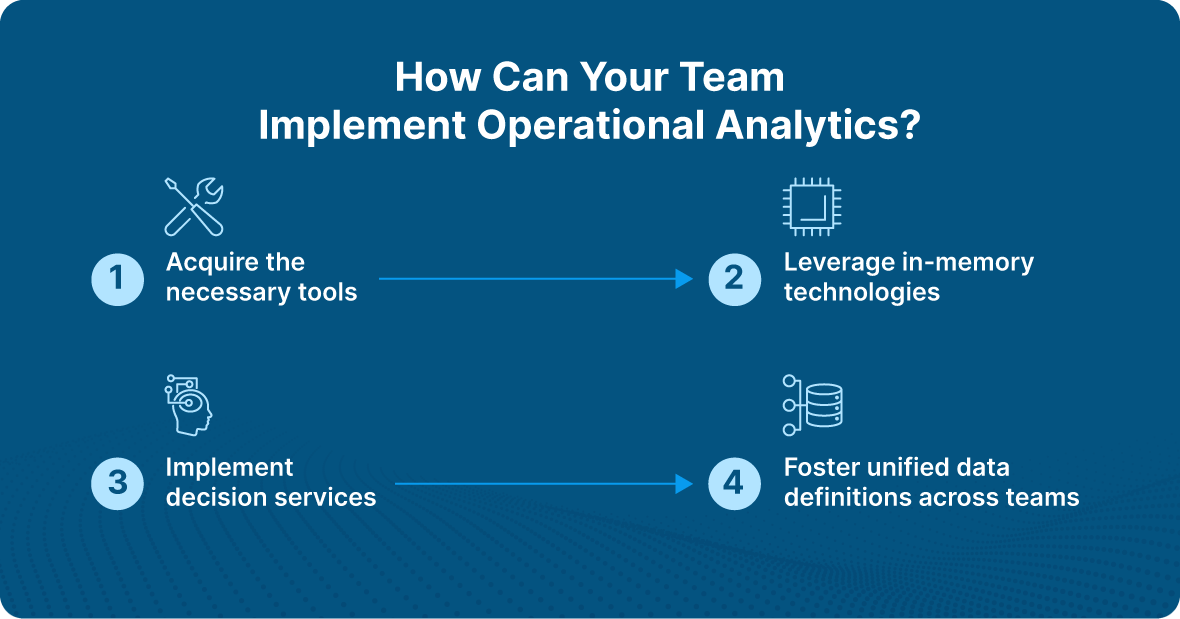
How Can Your Team Implement Operational Analytics?
Implementing operational analytics requires leveraging the right technologies, processes, and collaboration to ensure real-time, actionable insights drive efficiency and decision-making. Here’s how to do so effectively:
1. Acquire the Necessary Tools
The foundation of operational analytics lies in having the right tools to handle diverse data sources and deliver real-time insights. Key components include:
- ETL Tools: To extract, transform, and load data from systems such as enterprise resource planning (ERP) software, customer relationship management (CRM) platforms, and other operational systems.
- BI Platforms: For data visualization and reporting.
- Data Repositories: Data lakes or warehouses to store and manage vast datasets.
- Specialized Tools for Data Modeling: These tools help create and refine analytics models to fit operational needs.
Real-time data processing capabilities are crucial for operational analytics, as they enable organizations to respond to changes immediately, improving agility and effectiveness.
2. Leverage In-Memory Technologies
Traditional BI tasks often rely on disk-stored database tables, which can cause latency. With the reduced cost of memory, in-memory technologies provide a faster alternative.
- How It Works: By loading data into a large memory pool, organizations can run entire algorithms directly within memory, reducing latency and accelerating insights.
- Use Cases: Financial institutions, for instance, use in-memory technologies to update risk models daily for thousands of securities and scenarios, enabling rapid investment and hedging decisions.
In-memory technologies are particularly valuable for real-time operational analytics, where speed and performance are critical to decision-making.
3. Implement Decision Services
Decision services are callable services designed to automate decision-making by combining predictive analytics, optimization technologies, and business rules.
- Key Benefits: They isolate business logic from processes, enabling reuse across multiple applications and improving efficiency.
- Example: An insurance company can use decision services to help customers determine the validity of a claim before filing.
To ensure effective implementation, decision services must access all existing data infrastructure components, such as data warehouses, BI tools, and real-time data pipelines. This access ensures decisions are based on the most current and relevant information.
4. Foster Unified Data Definitions Across Teams
A shared understanding of data is essential to avoid delays and inconsistencies in operational analytics implementation. Ensure alignment across your analytics, IT, and business teams by:
- Standardizing Data Definitions: Consistency in modeling, testing, and reporting processes ensures smooth collaboration.
- Prioritizing Real-Time Alignment: Unified data definitions help ensure that real-time insights are actionable and reliable for all stakeholders.
Which Industries Benefit from Operational Analytics?
Operational analytics has the potential to transform a variety of industries by enabling real-time insights, improving efficiency, and enhancing decision-making.
Sales
Many organizations focus on collecting new data but overlook the untapped potential in their existing sales tools like Intercom, Salesforce, and HubSpot. This lack of insight can hinder their ability to optimize sales strategies.
Operational analytics helps businesses better utilize their existing data by creating seamless data flows within operational systems. With more contextual data:
- Sales representatives can improve lead scoring, targeting prospects with greater accuracy to boost conversions.
- Real-time, enriched data enables segmentation of customers into distinct categories, allowing tailored messaging that addresses specific pain points.
These improvements empower sales teams to act on high-quality data, driving better outcomes.
Industrial Production
Operational analytics supports predictive maintenance, enabling businesses to detect potential machine failures before they occur. Here’s how it works:
- Identify machines that frequently disrupt production.
- Analyze machine history and failure patterns (e.g., overheating motors).
- Develop a model to predict failure probabilities.
- Feed sensor data, such as temperature and vibration metrics, into the model.
Over time, the model learns from historical and real-time data to provide accurate failure estimates. Benefits include:
- Advanced planning of maintenance schedules to minimize downtime.
- Improved inventory management by identifying spare parts needed in advance.
These predictive capabilities enhance operational efficiency and reduce costly disruptions.
Supply Chain
Operational analytics can optimize supply chain processes by extracting insights from the vast data generated across procurement, processing, and distribution.
For example, a point-of-sale (PoS) terminal connected to a demand signal repository can use operational analytics to:
- Enable real-time ETL processes, sending live data to a central repository.
- Anticipate consumer demand with greater precision.
Additionally, prescriptive analytics within operational analytics helps manufacturers evaluate their supply chain partners. For instance:
- Identify suppliers with recurring delays due to diminished capacity or economic instability.
- Use this insight to address performance issues with suppliers or explore alternative partnerships.
By uncovering inefficiencies and enabling proactive decision-making, operational analytics strengthens supply chain reliability and responsiveness.
Real-World Operational Analytics Example
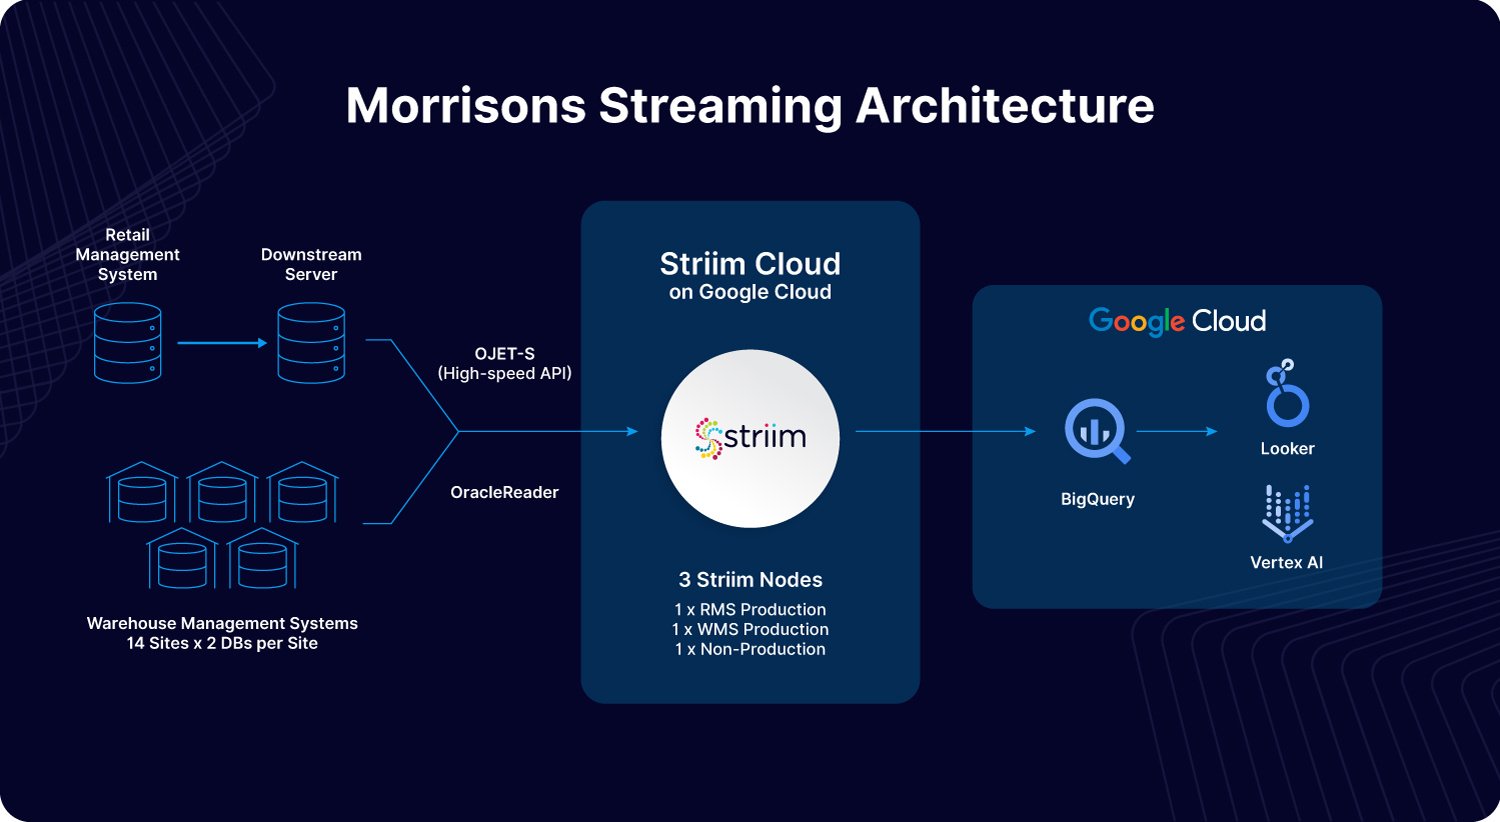
Morrisons, one of the UK’s largest supermarket chains, demonstrates how operational analytics can drive real-time decision-making and operational efficiency. By leveraging Striim’s real-time data integration platform, Morrisons modernized its data infrastructure to seamlessly connect systems such as its Retail Management System (RMS) and Warehouse Management System (WMS). This integration enabled Morrisons to ingest and analyze critical datasets in Google Cloud’s BigQuery, providing immediate insights into stock levels and operational performance.
For example, operational analytics allowed Morrisons to implement “live-pick” replenishment processes, ensuring on-shelf availability while reducing waste and inefficiencies. Real-time visibility into KPIs such as inventory levels, shrinkage, and availability empowered their teams—from senior leadership to store staff—to make informed decisions instantly. By embedding analytics into daily workflows, Morrisons created a data-driven culture that improved customer satisfaction and operational agility. This transformation highlights the power of operational analytics to optimize processes and enhance outcomes in the retail industry.
What Tools Are Available for Operational Analytics?
One common challenge with operational analytics is ensuring that tools can sync and share data seamlessly. Reliable data flow between applications is essential, yet many software platforms only move data into a data warehouse, leaving the task of operationalizing that data unresolved. Data latency further complicates the issue, making it difficult to display up-to-date insights on dashboards. This is where Striim stands out, offering powerful capabilities to address these challenges.
Striim provides real-time integrations for virtually any type of data pipeline. Whether you need to move data into or out of a data warehouse, Striim ensures that operational systems receive data quickly and reliably. Additionally, Striim allows users to build customized dashboards for operational analytics, providing actionable insights in real time.
Gaining Employee Buy-In for Operational Analytics
Adopting operational analytics often involves organizational changes that may challenge existing workflows. Decisions based on analytics can shift responsibilities, empowering junior staff to make decisions they previously deferred to senior colleagues. This shift can create unease among employees used to manual decision-making processes.
To ensure a smooth transition, organizations should involve employees from the start, demonstrating how operational analytics can enhance their work. Automation can free up time for more meaningful tasks, improving overall productivity and reducing repetitive workloads. By gaining employee confidence and highlighting the benefits, organizations can foster acceptance and ensure a successful rollout of operational analytics.
Improve Efficiency with Operational Analytics
Operational analytics empowers organizations to optimize daily operations by transforming raw data into actionable, real-time insights. Unlike traditional business intelligence, which focuses on long-term strategies, operational analytics hones in on immediate, tactical decisions, enhancing efficiency and agility.
Industries like retail, industrial production, and supply chain management use operational analytics to drive predictive maintenance, improve customer segmentation, and ensure real-time decision-making. Tools like Striim facilitate seamless data integration, real-time dashboards, and reduced latency, enabling businesses to respond proactively to operational challenges. By aligning technology, processes, and employee buy-in, operational analytics fosters a data-driven culture that enhances performance and drives success.
Ready to unlock the power of real-time insights with Striim? Get a demo today.


