


Business transactions captured in relational databases are critical to understanding the state of business operations. Since the value of data quickly drops over time, organizations need a way to analyze data as it is generated. To avoid disruptions to operational databases, companies typically replicate data to data warehouses for analysis.
Time-sensitive is also a major consideration in cloud migrations, where is continuously changing and shutting down the applications that connect to operational databases isn’t an option.
Traditionally, businesses used batch-based approaches to move data once or several times a day. However, batch movement introduces latency and reduces the operational value to the organization.
Change Data Capture (CDC) has emerged as an ideal solution for near real-time movement of data from relational databases (like SQL Server or Oracle) to data warehouses, data lakes or other databases. In this post, we’ll share why Change Data Capture is ideal for near-real-time business intelligence and cloud migrations, and four different Change Data Capture methods.
- What is Change Data Capture?
- Change Data Capture for ETL
- Change Data Capture Methods
- Data Integration Platforms for Change Data Capture
What is Change Data Capture?
Change Data Capture is a software process that identifies and tracks changes to data in a database. CDC provides real-time or near-real-time movement of data by moving and processing data continuously as new database events occur.
In high-velocity data environments where time-sensitive decisions are made, Change Data Capture is an excellent fit to achieve low-latency, reliable, and scalable data replication. Change Data Capture is also ideal for zero-downtime migrations to the cloud.
With over 80% of companies planning on implementing multi-cloud strategies by 2025, picking the right change data capture method for your business is more critical than ever given the need to replicate data across multiple environments.
Change Data Capture for ETL
ETL (extract, transform, load) is a data integration process in which data is extracted from various sources and delivered to a data warehouse, database, or data lake. Data can be extracted using database queries (batch-based) or Change Data Capture (near-real-time).
During the transformation phase, data is processed and converted into the appropriate format for the target destination. While legacy ETL has a slow transformation step, modern ETL platforms replace disk-based processing with in-memory processing to allow for real-time data processing, enrichment, and analysis. The final step of ETL involves loading data into the target destination.
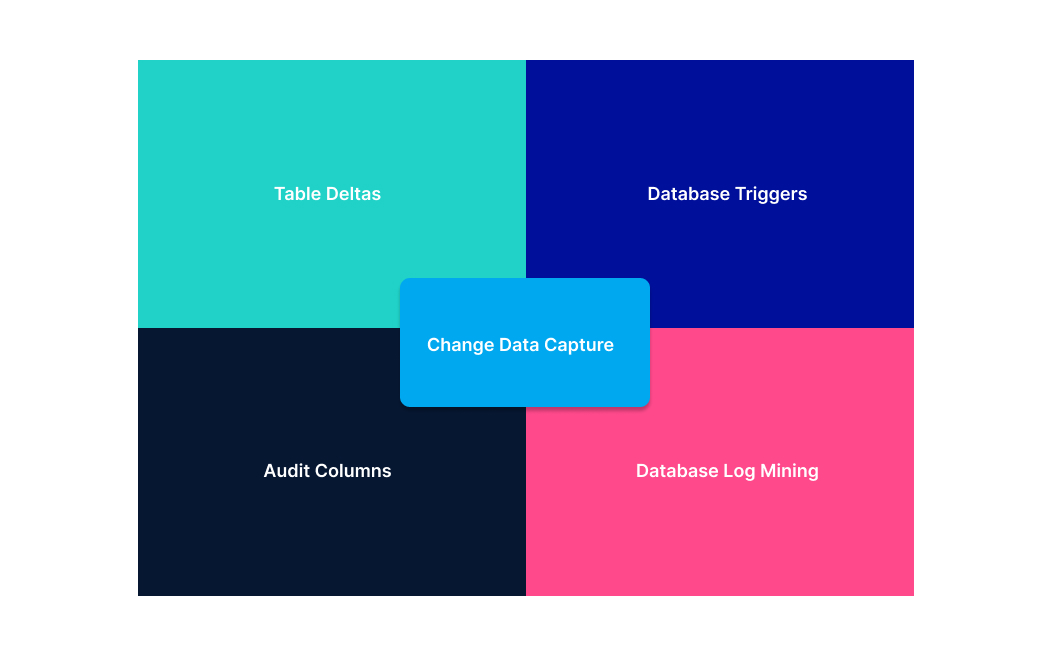
Change Data Capture Methods
There are multiple common Change Data Capture methods that you can implement depending on your application requirements and tolerance for performance overhead. Here are the common methods, how they work, and their advantages as well as shortcomings.
Audit Columns
By using existing “LAST_UPDATED” or “DATE_MODIFIED” columns, or by adding them if not available in the application, you can create your own change data capture solution at the application level. This approach retrieves only the rows that have been changed since the data was last extracted.
The CDC logic for the technique would be:
Step 1: Get the maximum value of both the target (blue) table’s ‘Created_Time’ and ‘Updated_Time’ columns
Step 2: Select all the rows from the data source with ‘Created_Time’ greater than (>) the target table’s maximum ‘Created_Time’ , which are all the newly created rows since the last CDC process was executed.
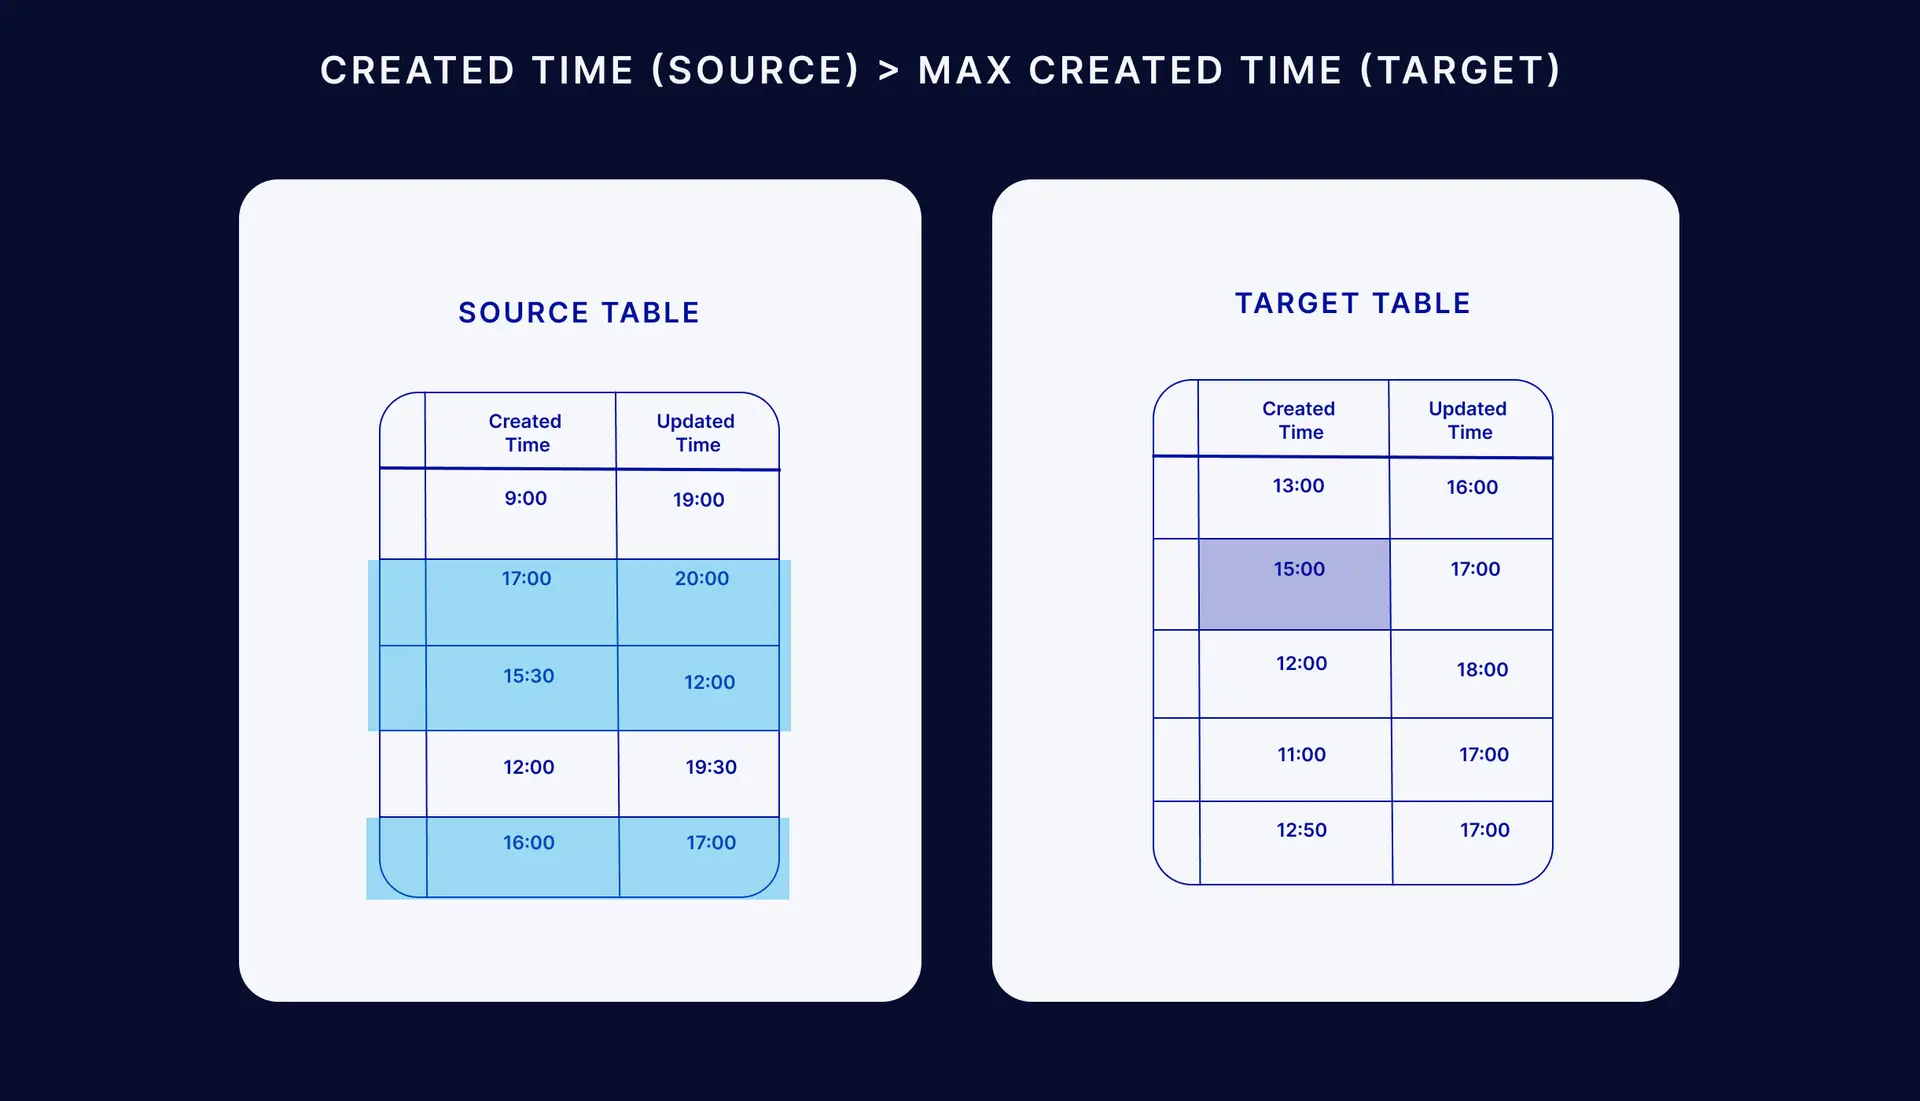
Step 3: Select all rows from the source table that have an ‘Updated_Time’ greater than (>) the target table’s maximum ‘Updated_Time’ but less than (<) its maximum ‘Created_Time’. The reason for the exclusion of rows less than the maximum target create date is that they were included in step 2.
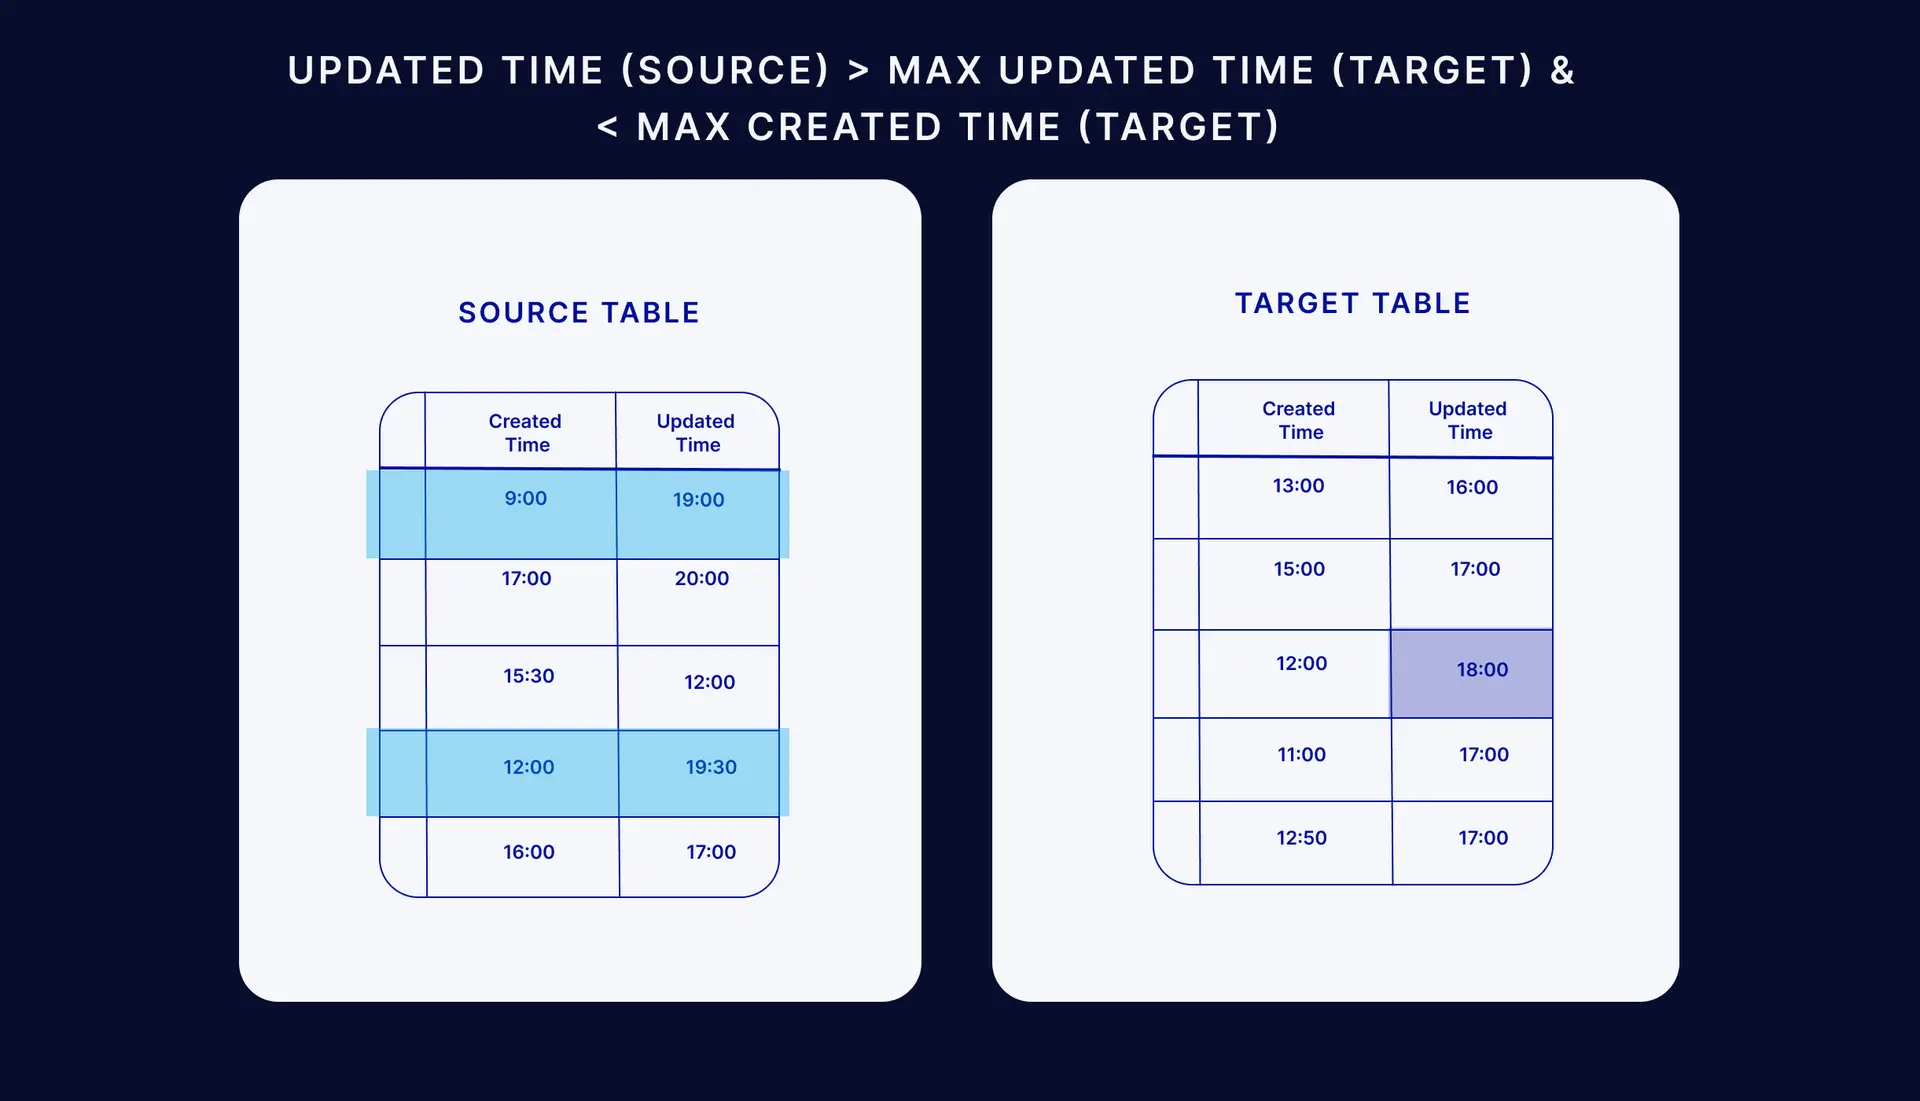
Step 4: Insert new rows from step 2 or modify existing rows from step 3 in the target.
Pros of this method
- It can be built with native application logic
- It doesn’t require any external tooling
Cons of this method
- Adds additional overhead to the database
- DML statements such as deletes will not be propagated to the target without additional scripts to track deletes
- Error prone and likely to cause issues with data consistency
This approach also requires CPU resources to scan the tables for the changed data and maintenance resources to ensure that the DATE_MODIFIED column is applied reliably across all source tables.
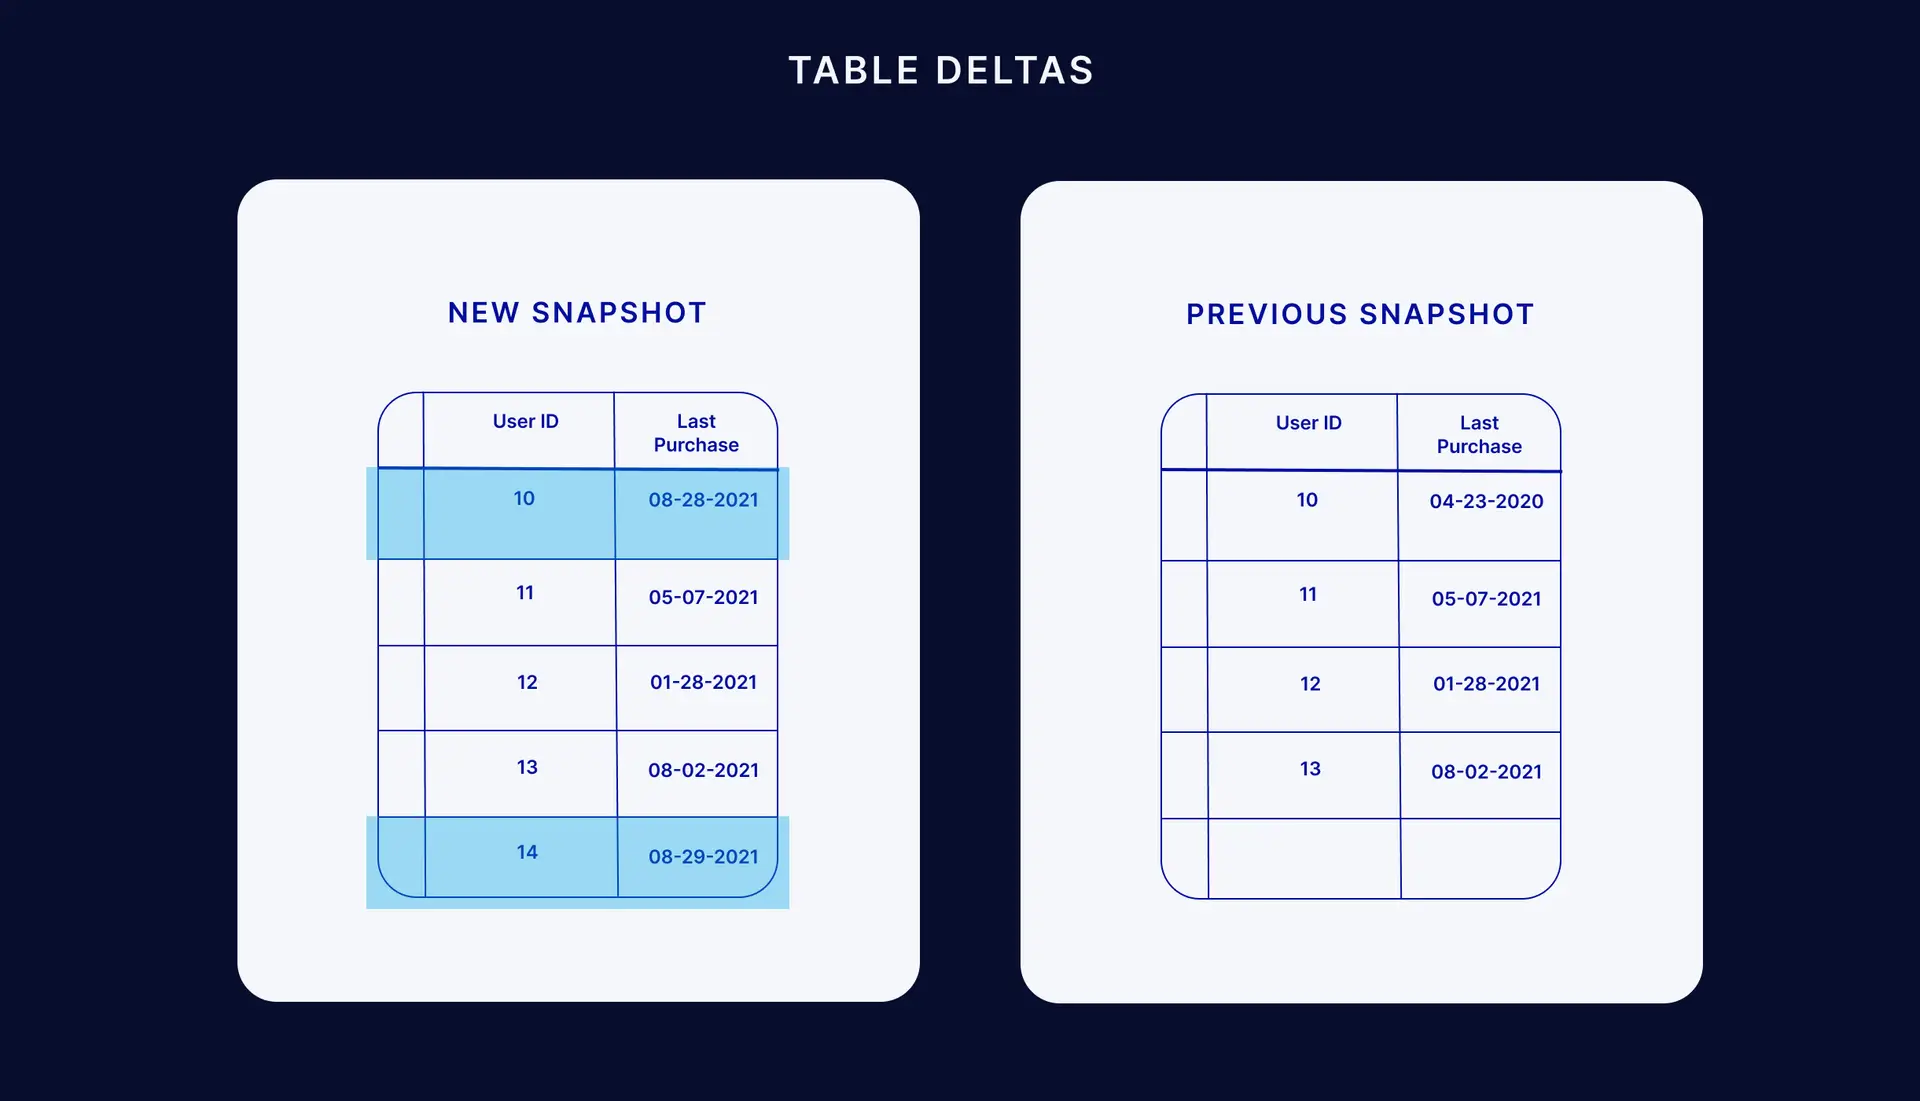
Table Deltas
You can use table delta or ‘tablediff’ utilities to compare the data in two tables for non-convergence. Then you can use additional scripts to apply the deltas from the source table to the target as another approach to change data capture. There are several examples of SQL scripts that can find the difference of two tables.
Advantages of this approach:
- It provides an accurate view of changed data while only using native SQL scripts
Disadvantage of this approach:
- Demand for storage significantly increases because you need three copies of the data sources that are being used in this technique: the original data, previous snapshot, and current snapshot
- It does not scale well in applications with heavy transactional workloads
Although this works better for managing deleted rows, the CPU resources required to identify the differences are significant and the overhead increases linearly with the volume of data. The diff method also introduces latency and cannot be performed in real time.
Some log-based change data capture tools come with the ability to analyze different tables to ensure replication consistency.
Trigger-based CDC
Another method for building change data capture at the application level is defining database triggers and creating your own change log in shadow tables. Triggers fire before or after INSERT, UPDATE, or DELETE commands (that indicate a change) and are used to create a change log. Operating at the SQL level, some users prefer this approach. Some databases even have native support for triggers.
However, triggers are required for each table in the source database, and they have greater overhead associated with running triggers on operational tables while the changes are being made. In addition to having a significant impact on the performance of the application, maintaining the triggers as the application change leads to management burden.
Advantages of this approach:
- Shadow tables can provide an immutable, detailed log of all transactions
- Directly supported in the SQL API for some databases
Disadvantage of this approach:
- Significantly reduces the performance of the database by requiring multiple writes to a database every time a row is inserted, updated, or deleted
Many application users do not want to risk the application behavior by introducing triggers to operational tables. DBAs and data engineers should always heavily test the performance of any triggers added into their environment and decide if they can tolerate the additional overhead.
Log-Based Change Data Capture
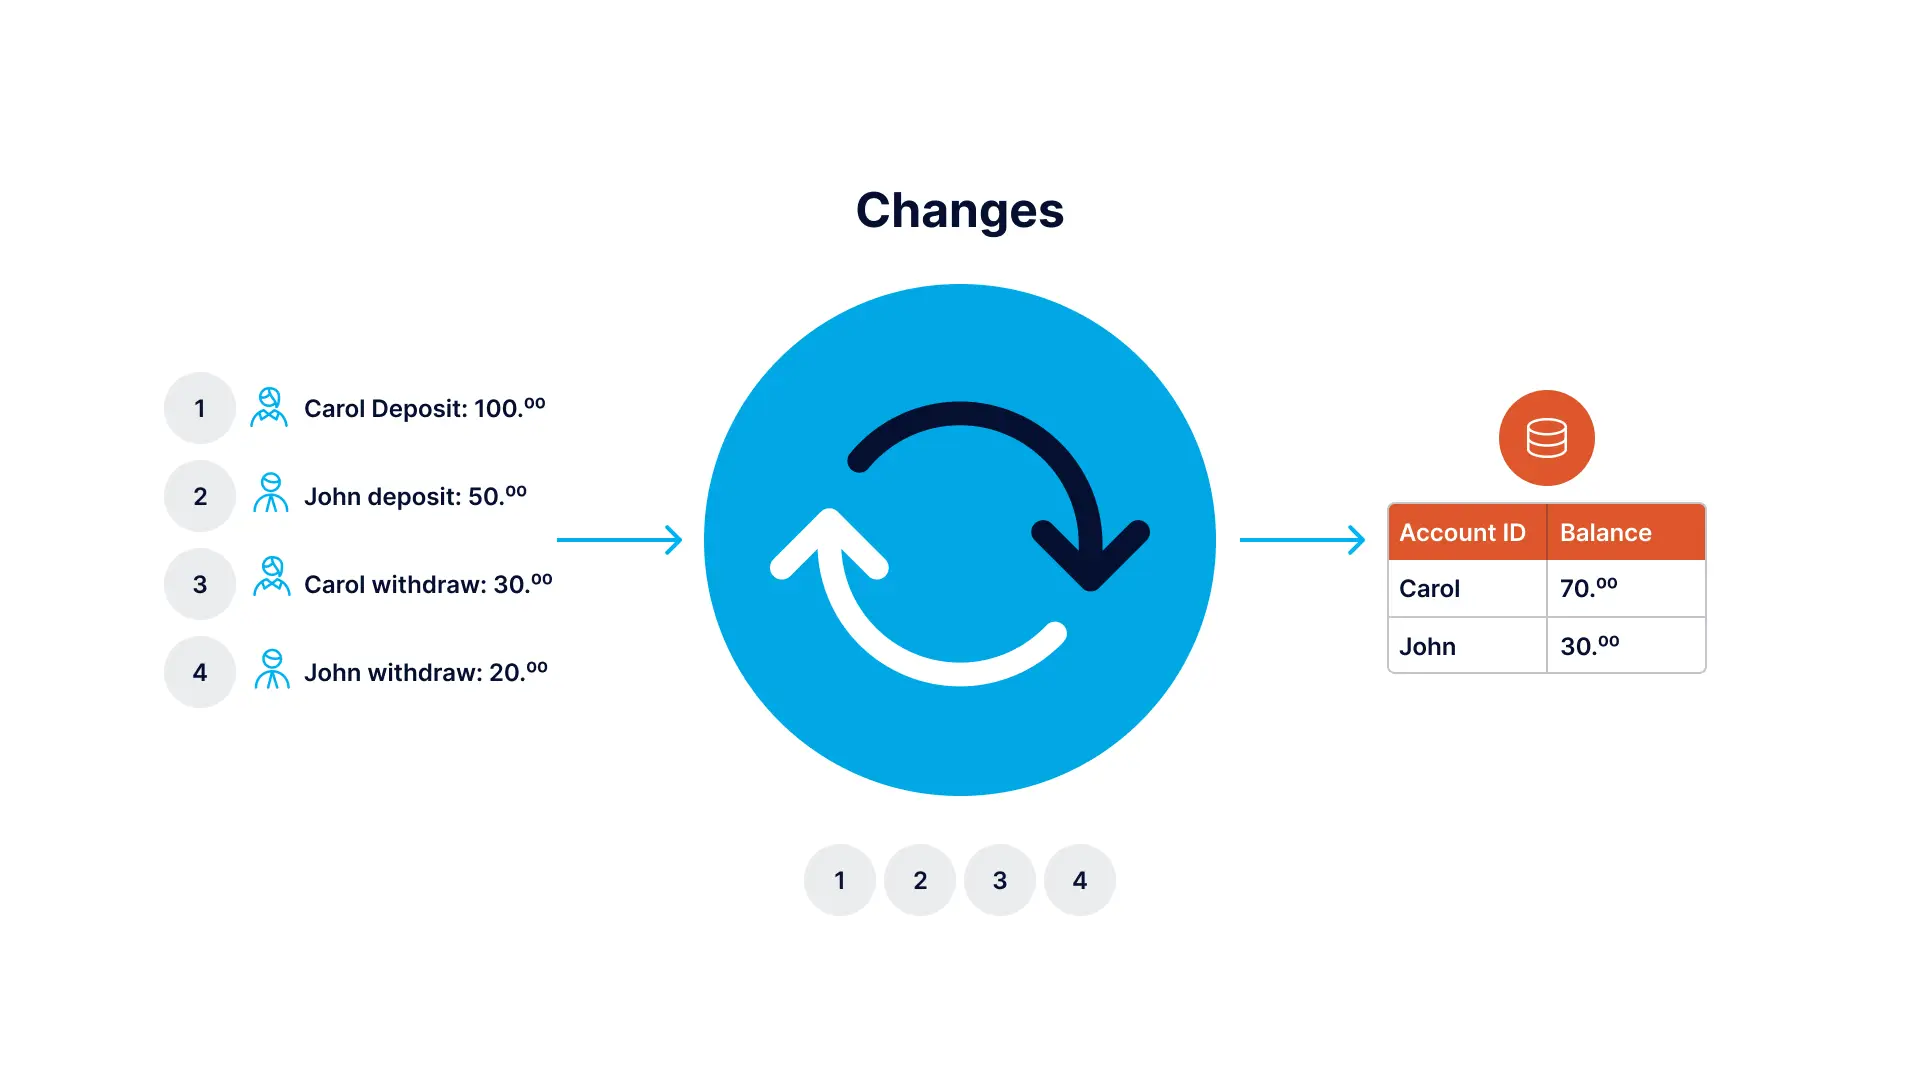
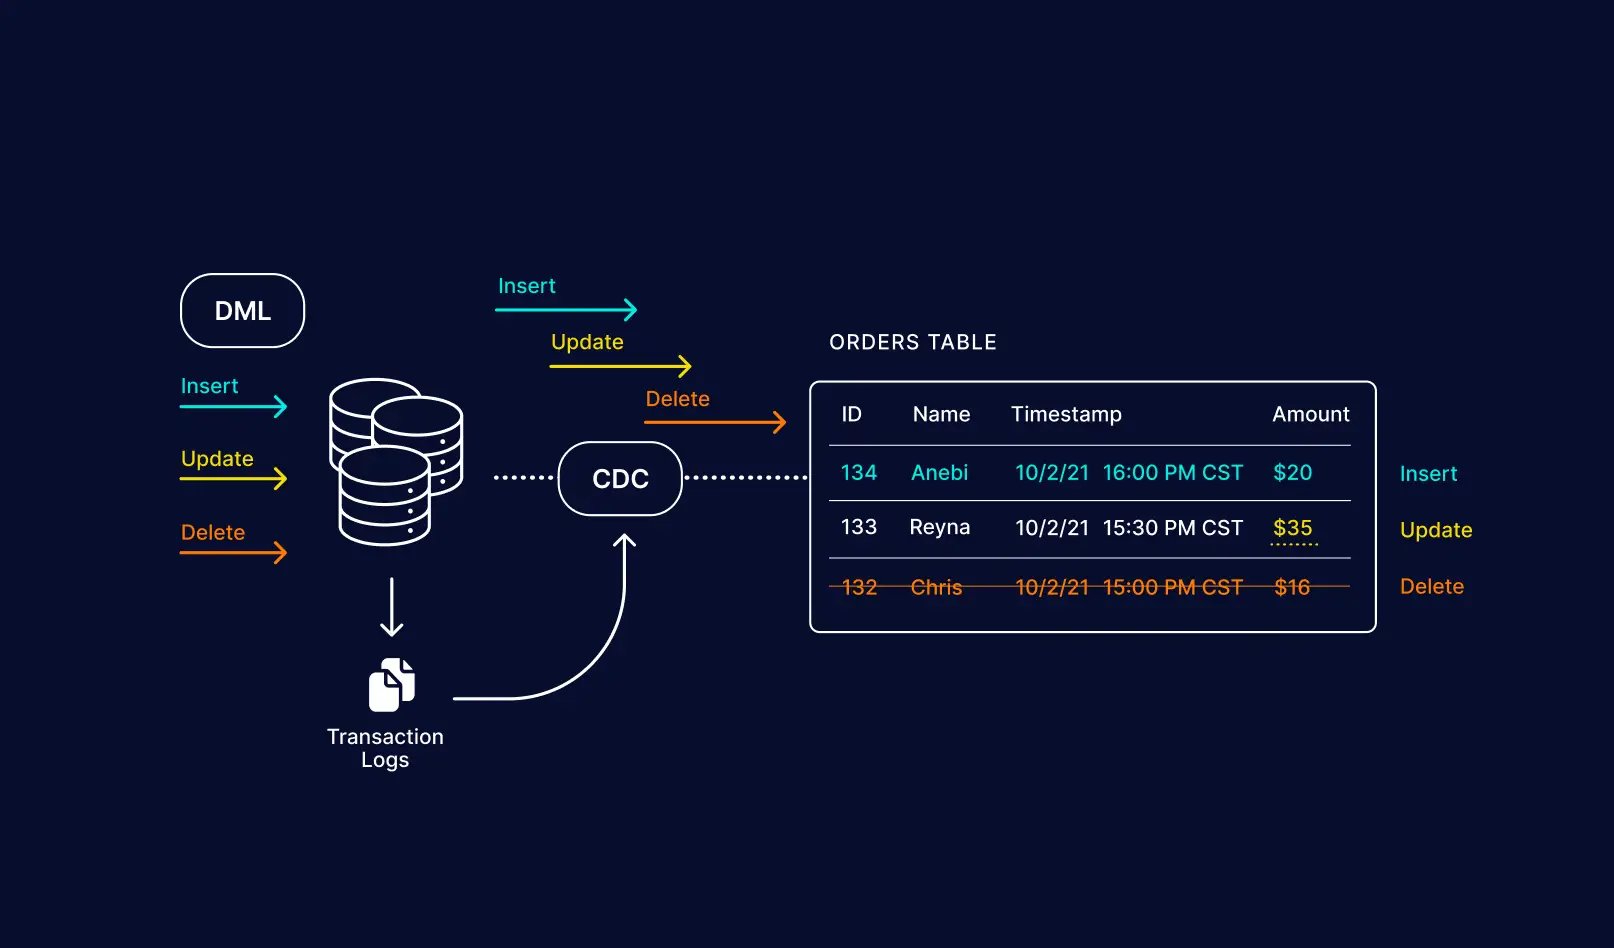
Databases contain transaction logs (also called redo logs) that store all database events allowing for the database to be recovered in the event of a crash. With log-based change data capture, new database transactions – including inserts, updates, and deletes – are read from source databases’ native transaction logs.
The changes are captured without making application level changes and without having to scan operational tables, both of which add additional workload and reduce source systems’ performance.
Advantages of this approach
- Minimal impact on production database system – no additional queries required for each transaction
- Can maintain ACID reliability across multiple systems
- No requirement to change the production database system’s schemas or the need to add additional tables
Challenges of this approach
- Parsing the internal logging format of a database is complex – most databases do not document the format nor do they announce changes to it in new releases. This would potentially require you to change your database log parsing logic with each new database release.
- Would need system to manage the source database change events metadata
- Additional log levels required to produce scannable transaction logs can add marginal performance overhead
Data Integration Platforms for Change Data Capture
Data integration platforms that natively perform change data capture can handle the complexity mentioned above by automatically mining the database change logs while managing additional metadata to ensure the replication between two or more systems is reliable.
Striim’s data integration platform allows for low-impact, real-time log-based change data capture from your databases, including CDC for Oracle and SQL Server CDC. Striim can replicate data to various targets including Snowflake and Azure.
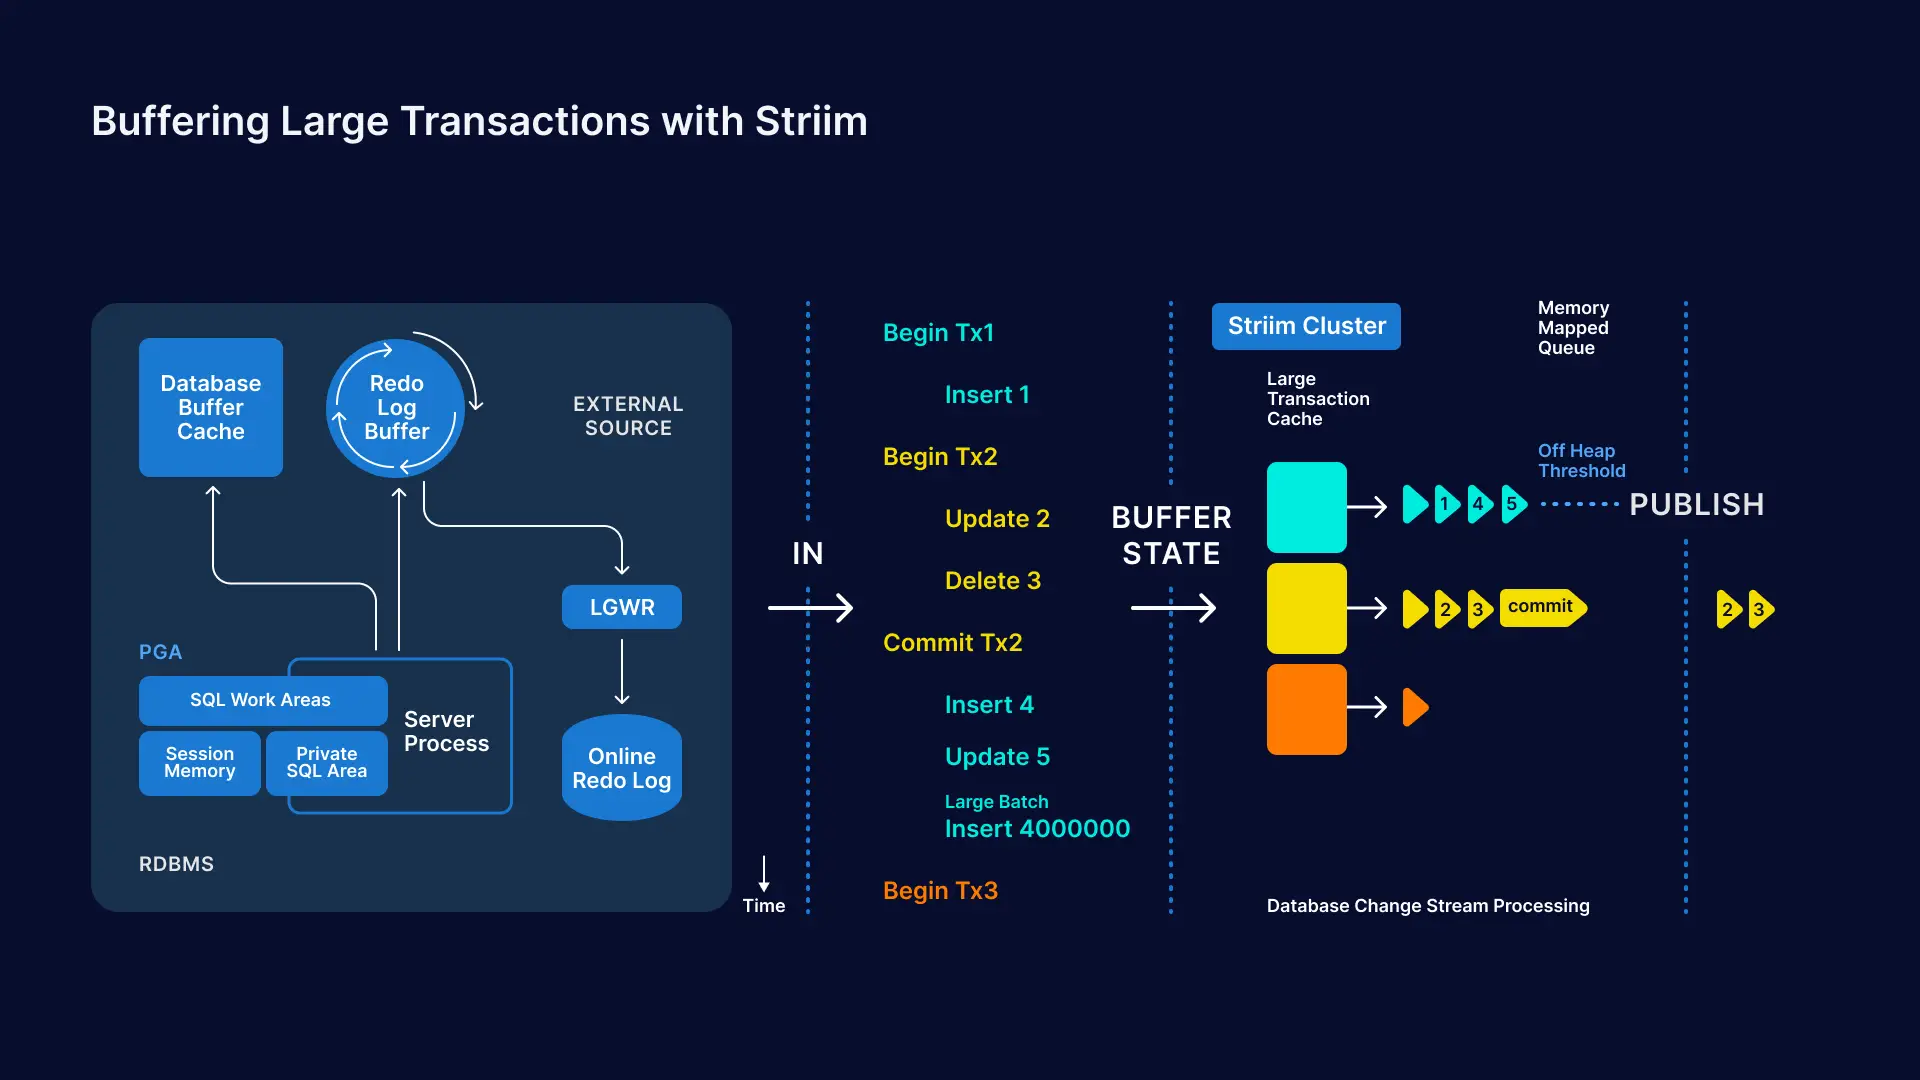
Striim allows users to define how they want to receive the stream of change events. For example, users can choose to receive only committed transactions (as depicted in the diagram above) as an event stream. Or, instead of committed transactions, users can choose to receive time-ordered events over specific time windows.
For larger workloads, users can configure an off-heap threshold so that long-running transactions are seamlessly buffered to disk, with minimal performance overhead.
Schedule a demo and we’ll give you a personalized walkthrough or try Striim at production-scale for free! Small data volumes or hoping to get hands on quickly? At Striim we also offer a free developer version.