Creating a data validation dashboard
Note
This feature is available in Striim Cloud Mission Critical but not in Striim Cloud Enterprise.
A data validation dashboard gives you a visual representation of data read and written by a Striim application. Supported sources and targets are:
Sources | Targets |
|---|---|
|
|
The application may have multiple sources and/or targets so long as they are all of the same type. For example, you could have multiple sources all using DatabaseReader and multiple targets all using KafkaWriter.
To create and view a data validation dashboard:
Undeploy the application.
Open the application in the Flow Designer, select Configuration > App Settings, enable data validation, and click Save.
Deploy and start the application, then select Configuration > View Validation Dashboard.
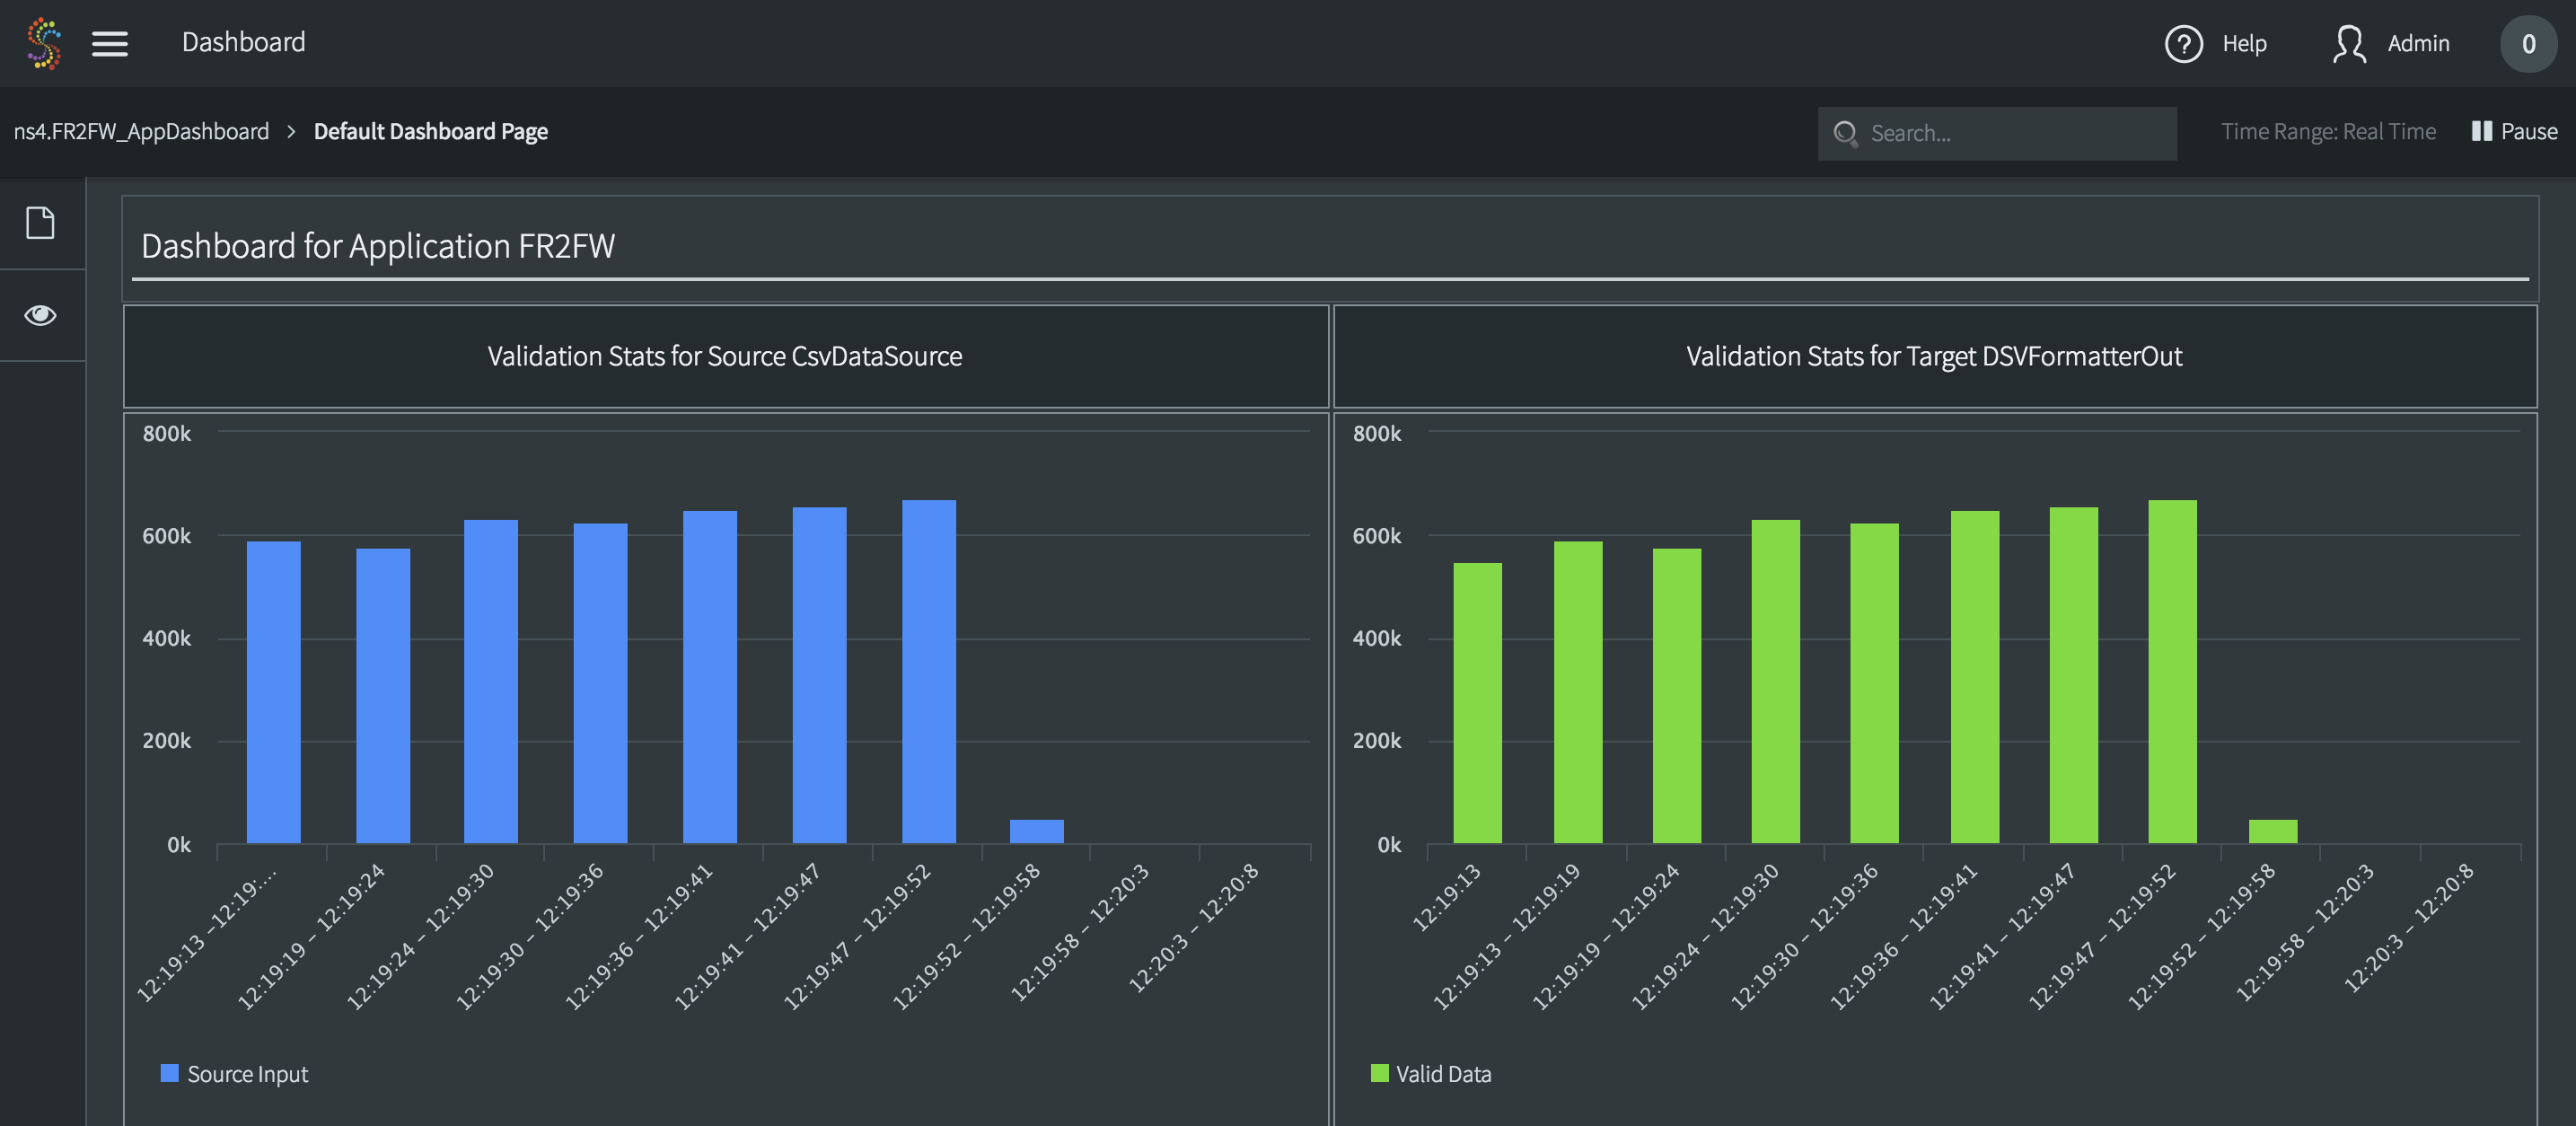
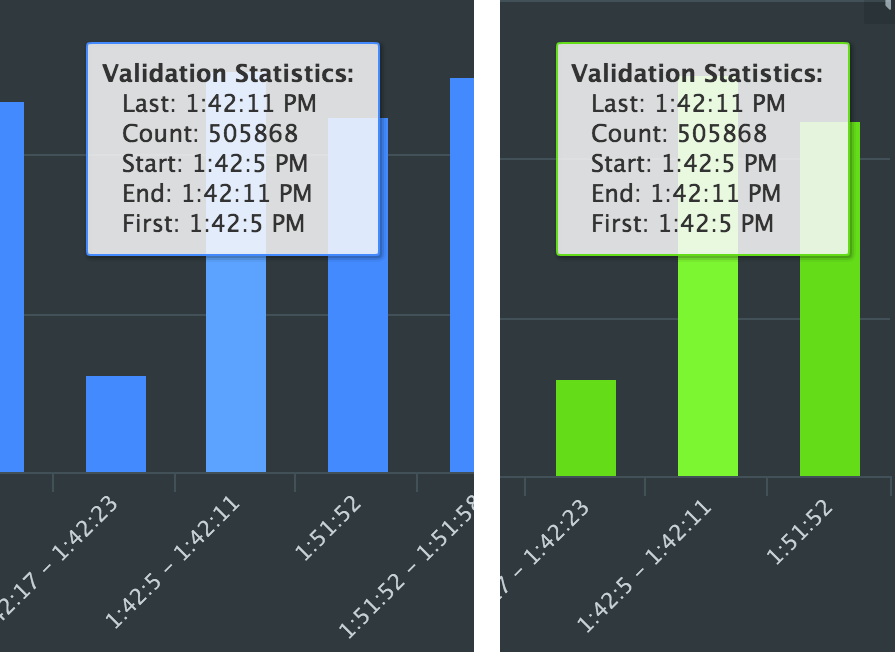
Hover the mouse pointer over a bar to see additional details for that source or target for the indicated time period. Click Pause to stop updating the dashboard temporarily so you can compare event counts and verify that all source data was written by the target.
Validation dashboards do not appear on the Dashboard page.