Using monitor reports
A monitor report provides summary information about a single component over a specified time range using a specified rollup period. For example, you could get a report showing how many events a source processed every 15 minutes for the past 24 hours.
To view a monitor report:
Go to the Monitor page, click the application name, and from the Component drop-down select the component to report on. (You may type a few characters of the component name to filter the drop-down.)
Set a start time, end time, and rollup interval for the report (for example, hourly for the past week, or every 15 minutes for the past day), then click Start.
The following example shows source performance from midnight until 11:00 am. You can see that performance was steady.
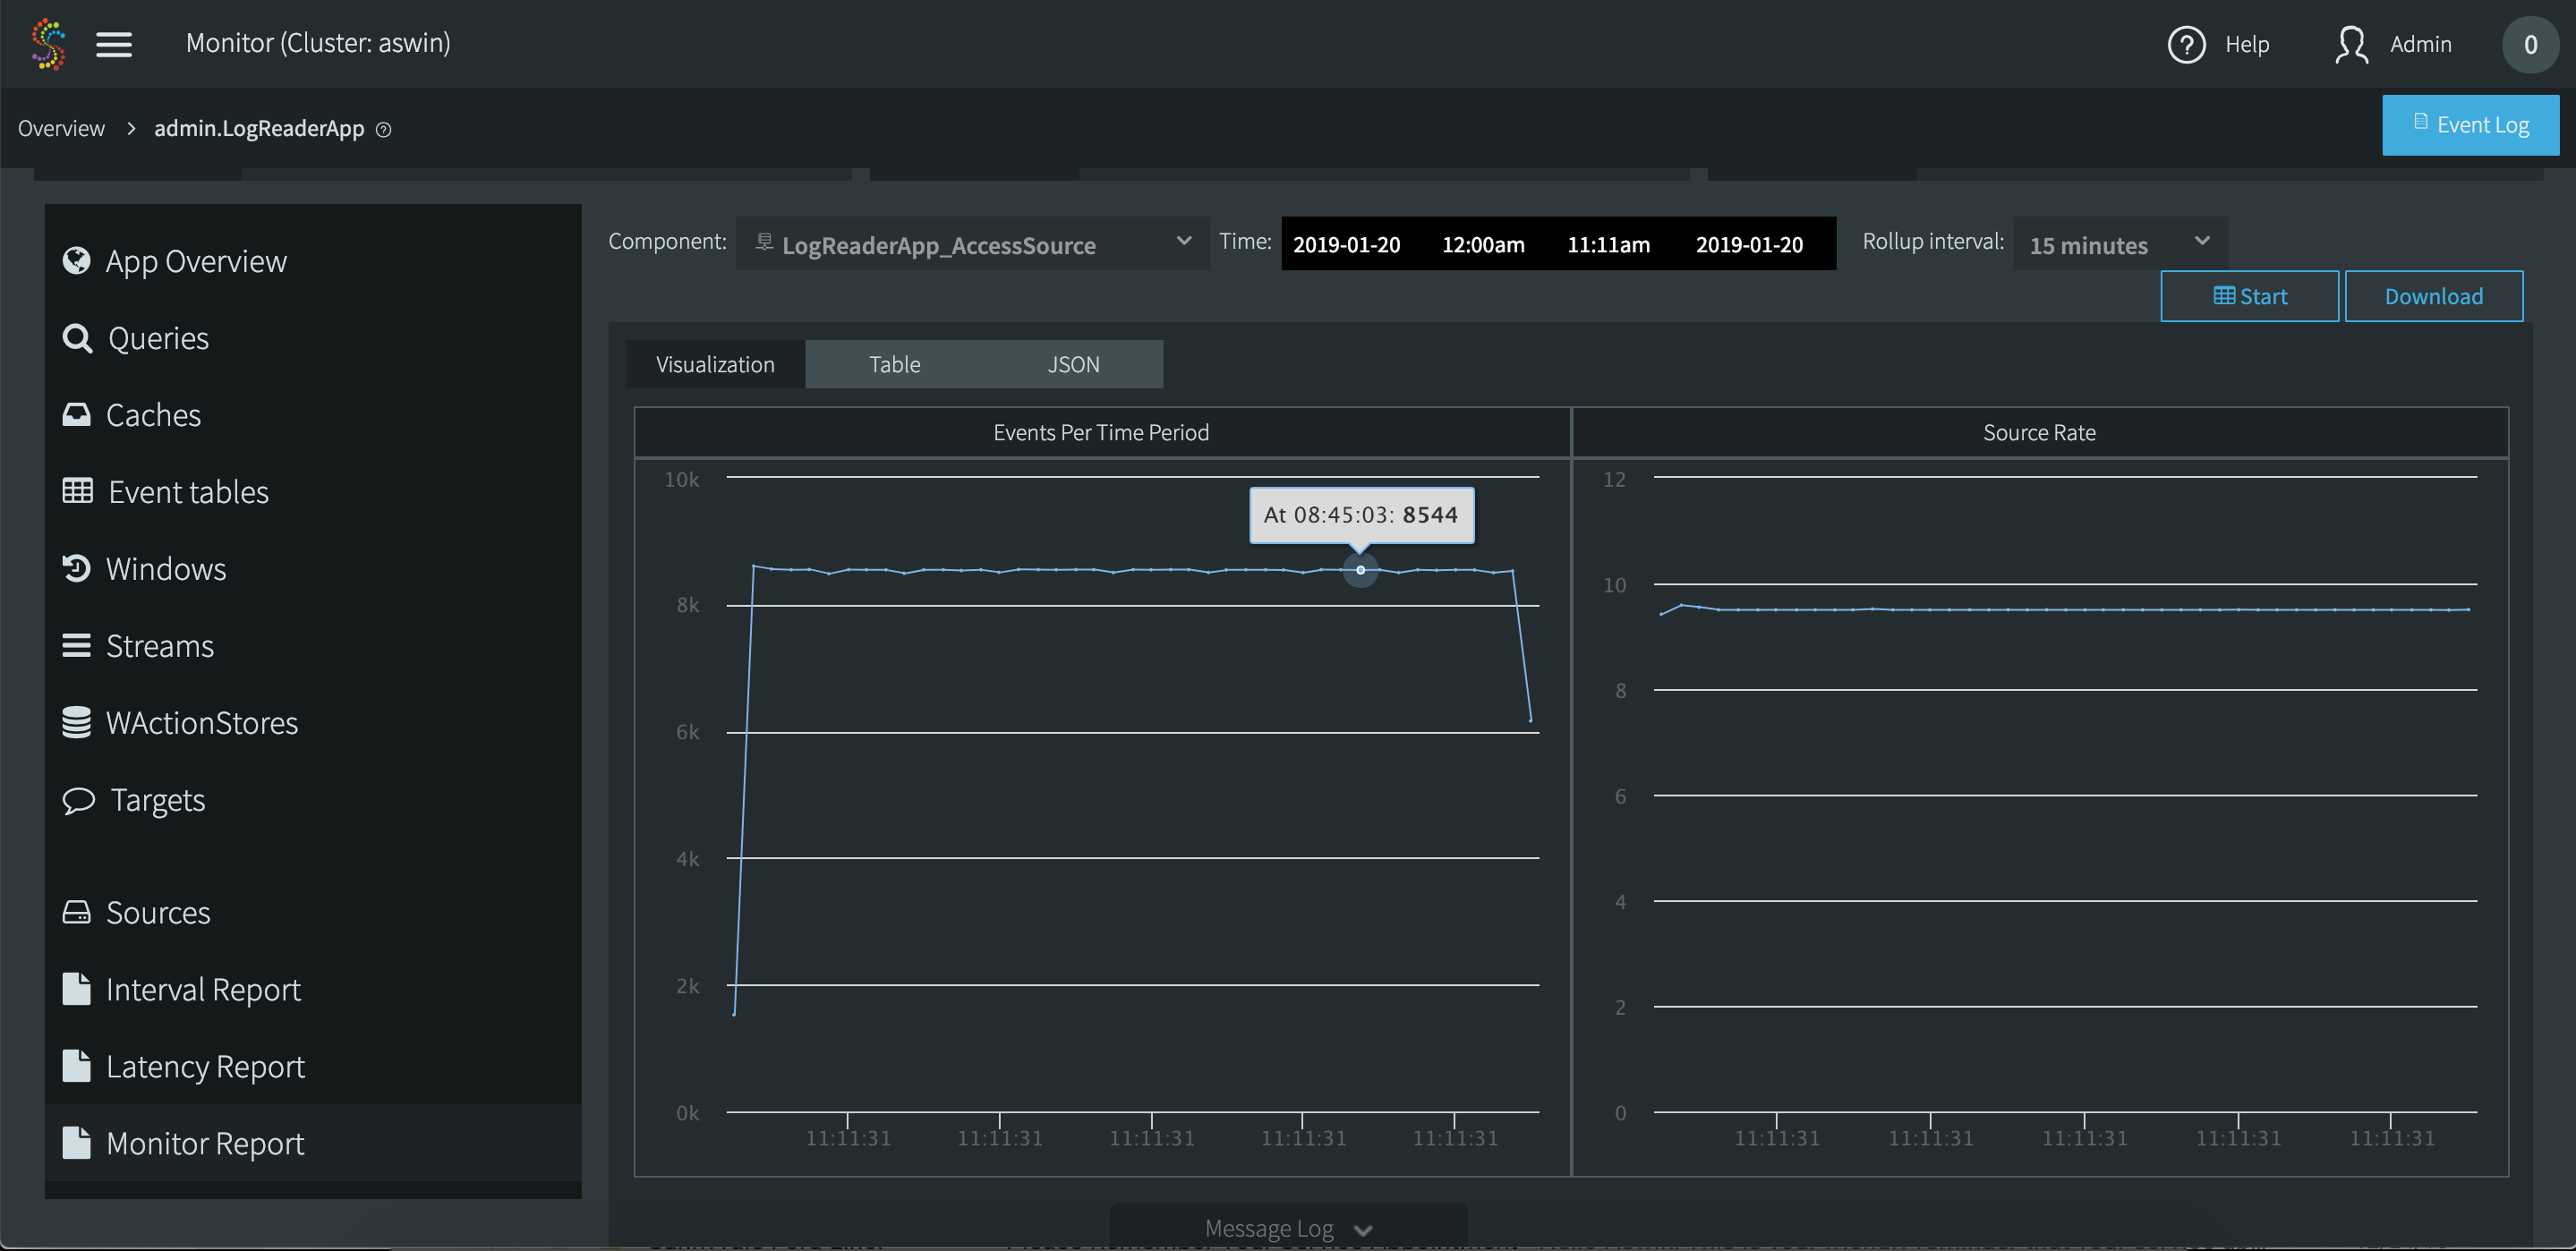
Hover the cursor over a point in the chart to get detailed data. Here you can see that from 8:30 to 8:45 the source processed 8544 events.
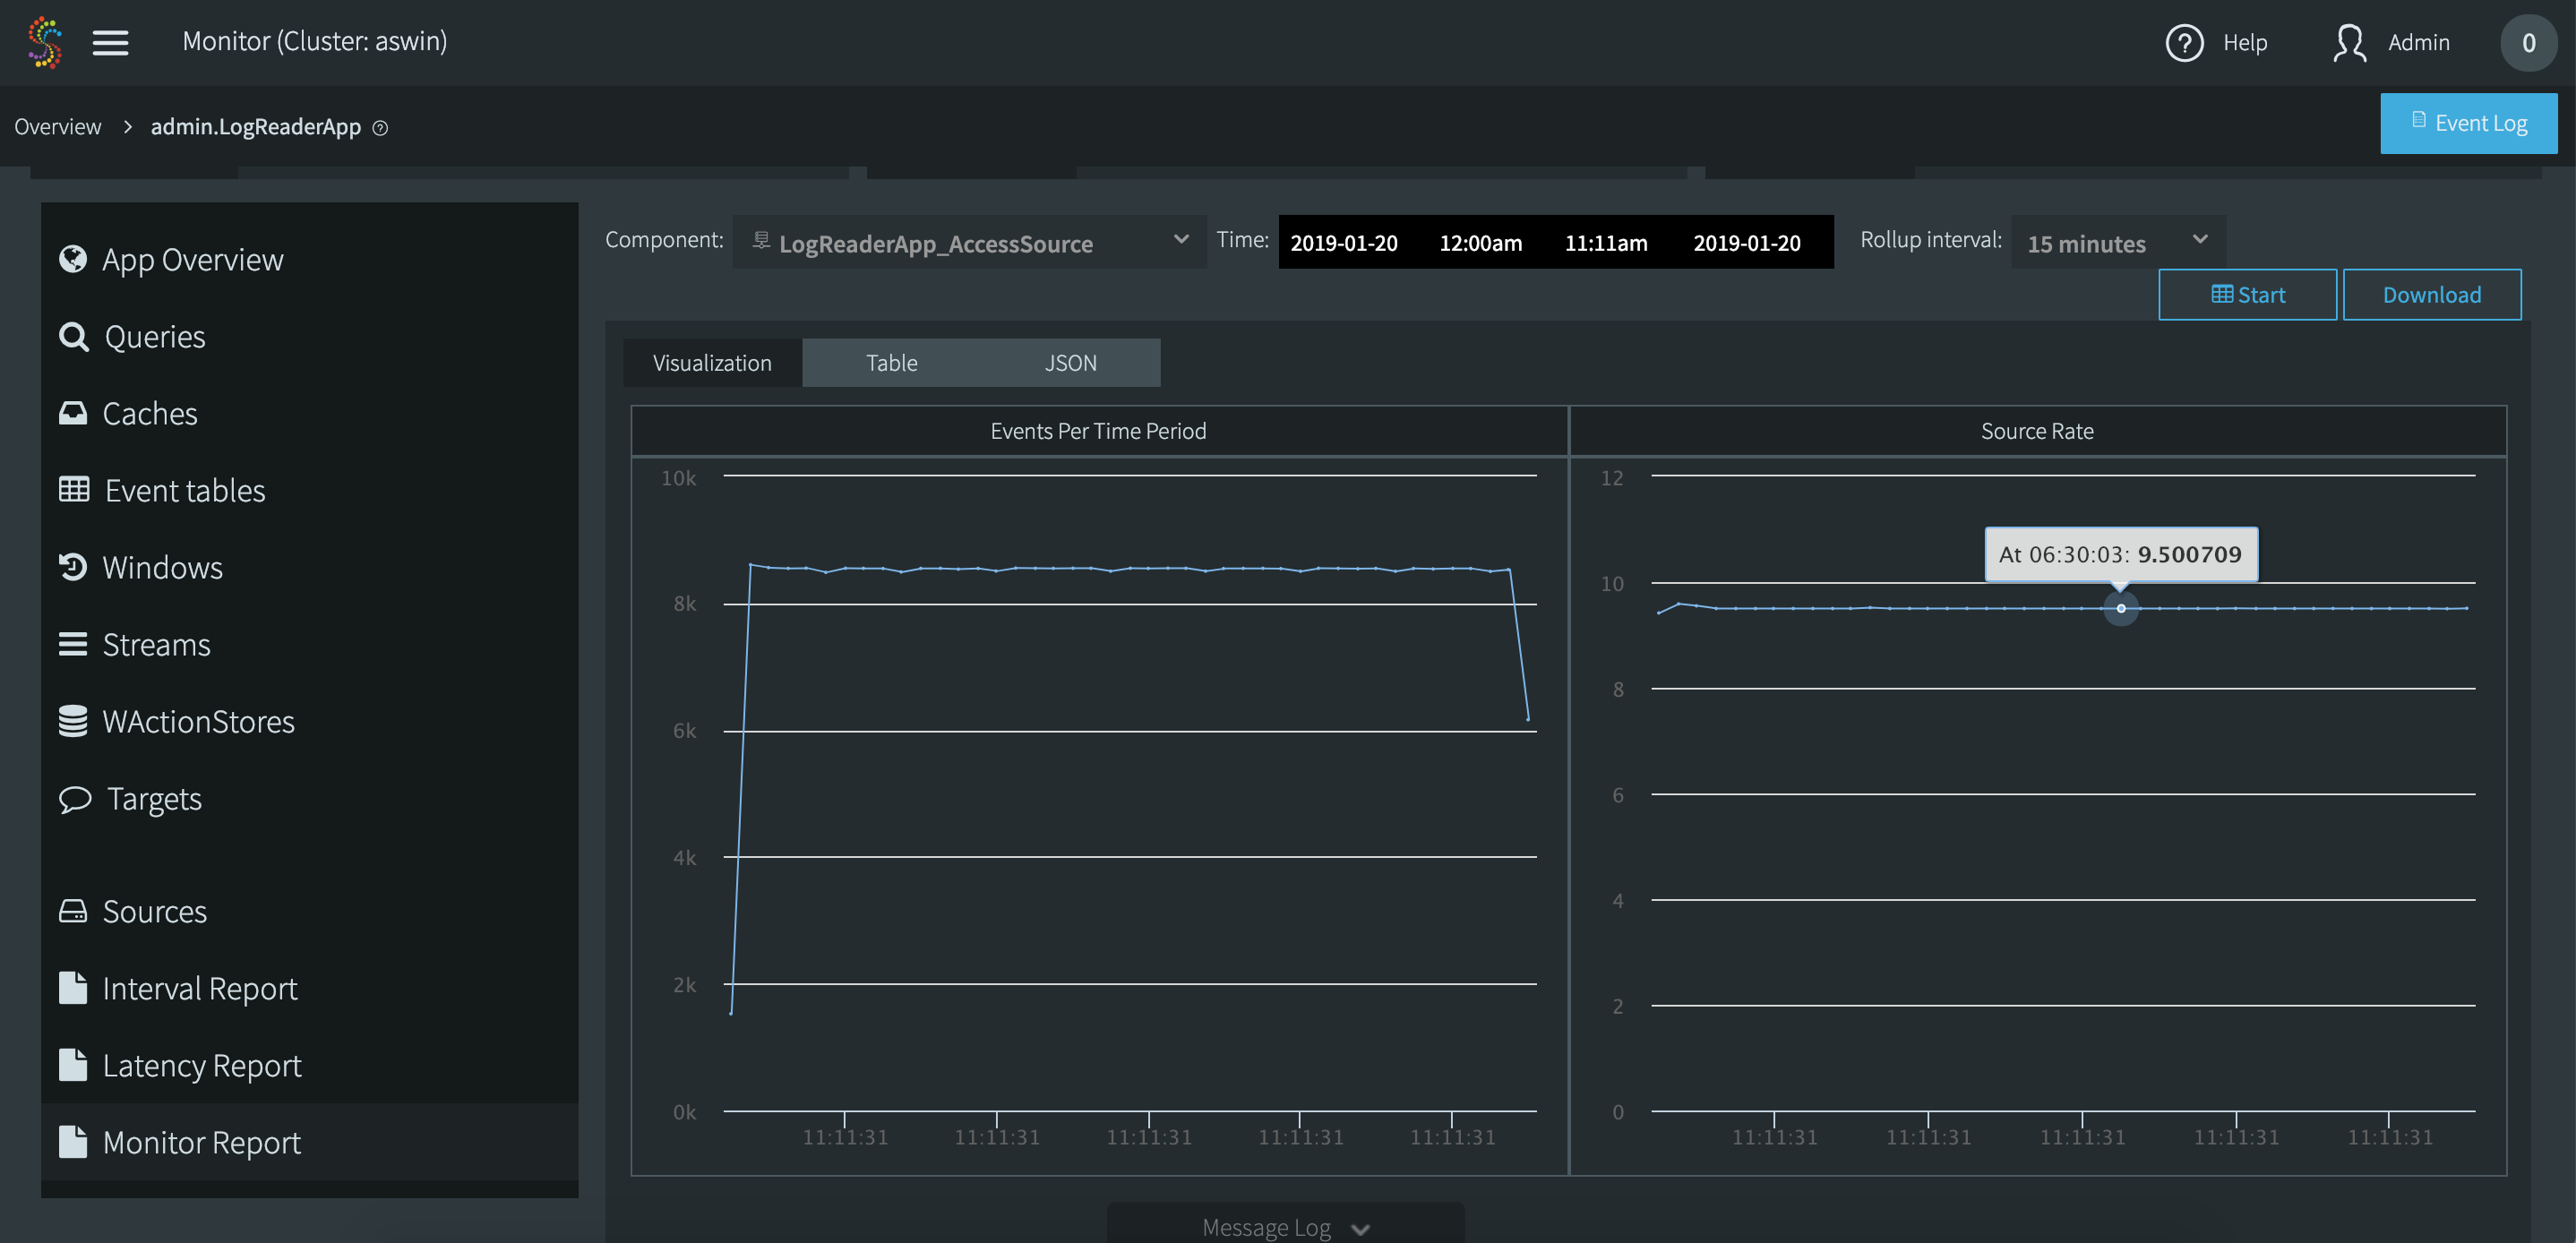
Here you can see that from 6:15 to 6:30 the source processed an average of 9.5 events per second. (This example was generated with a very slow source. In real-world applications, Striim can handle millions of events per second.)
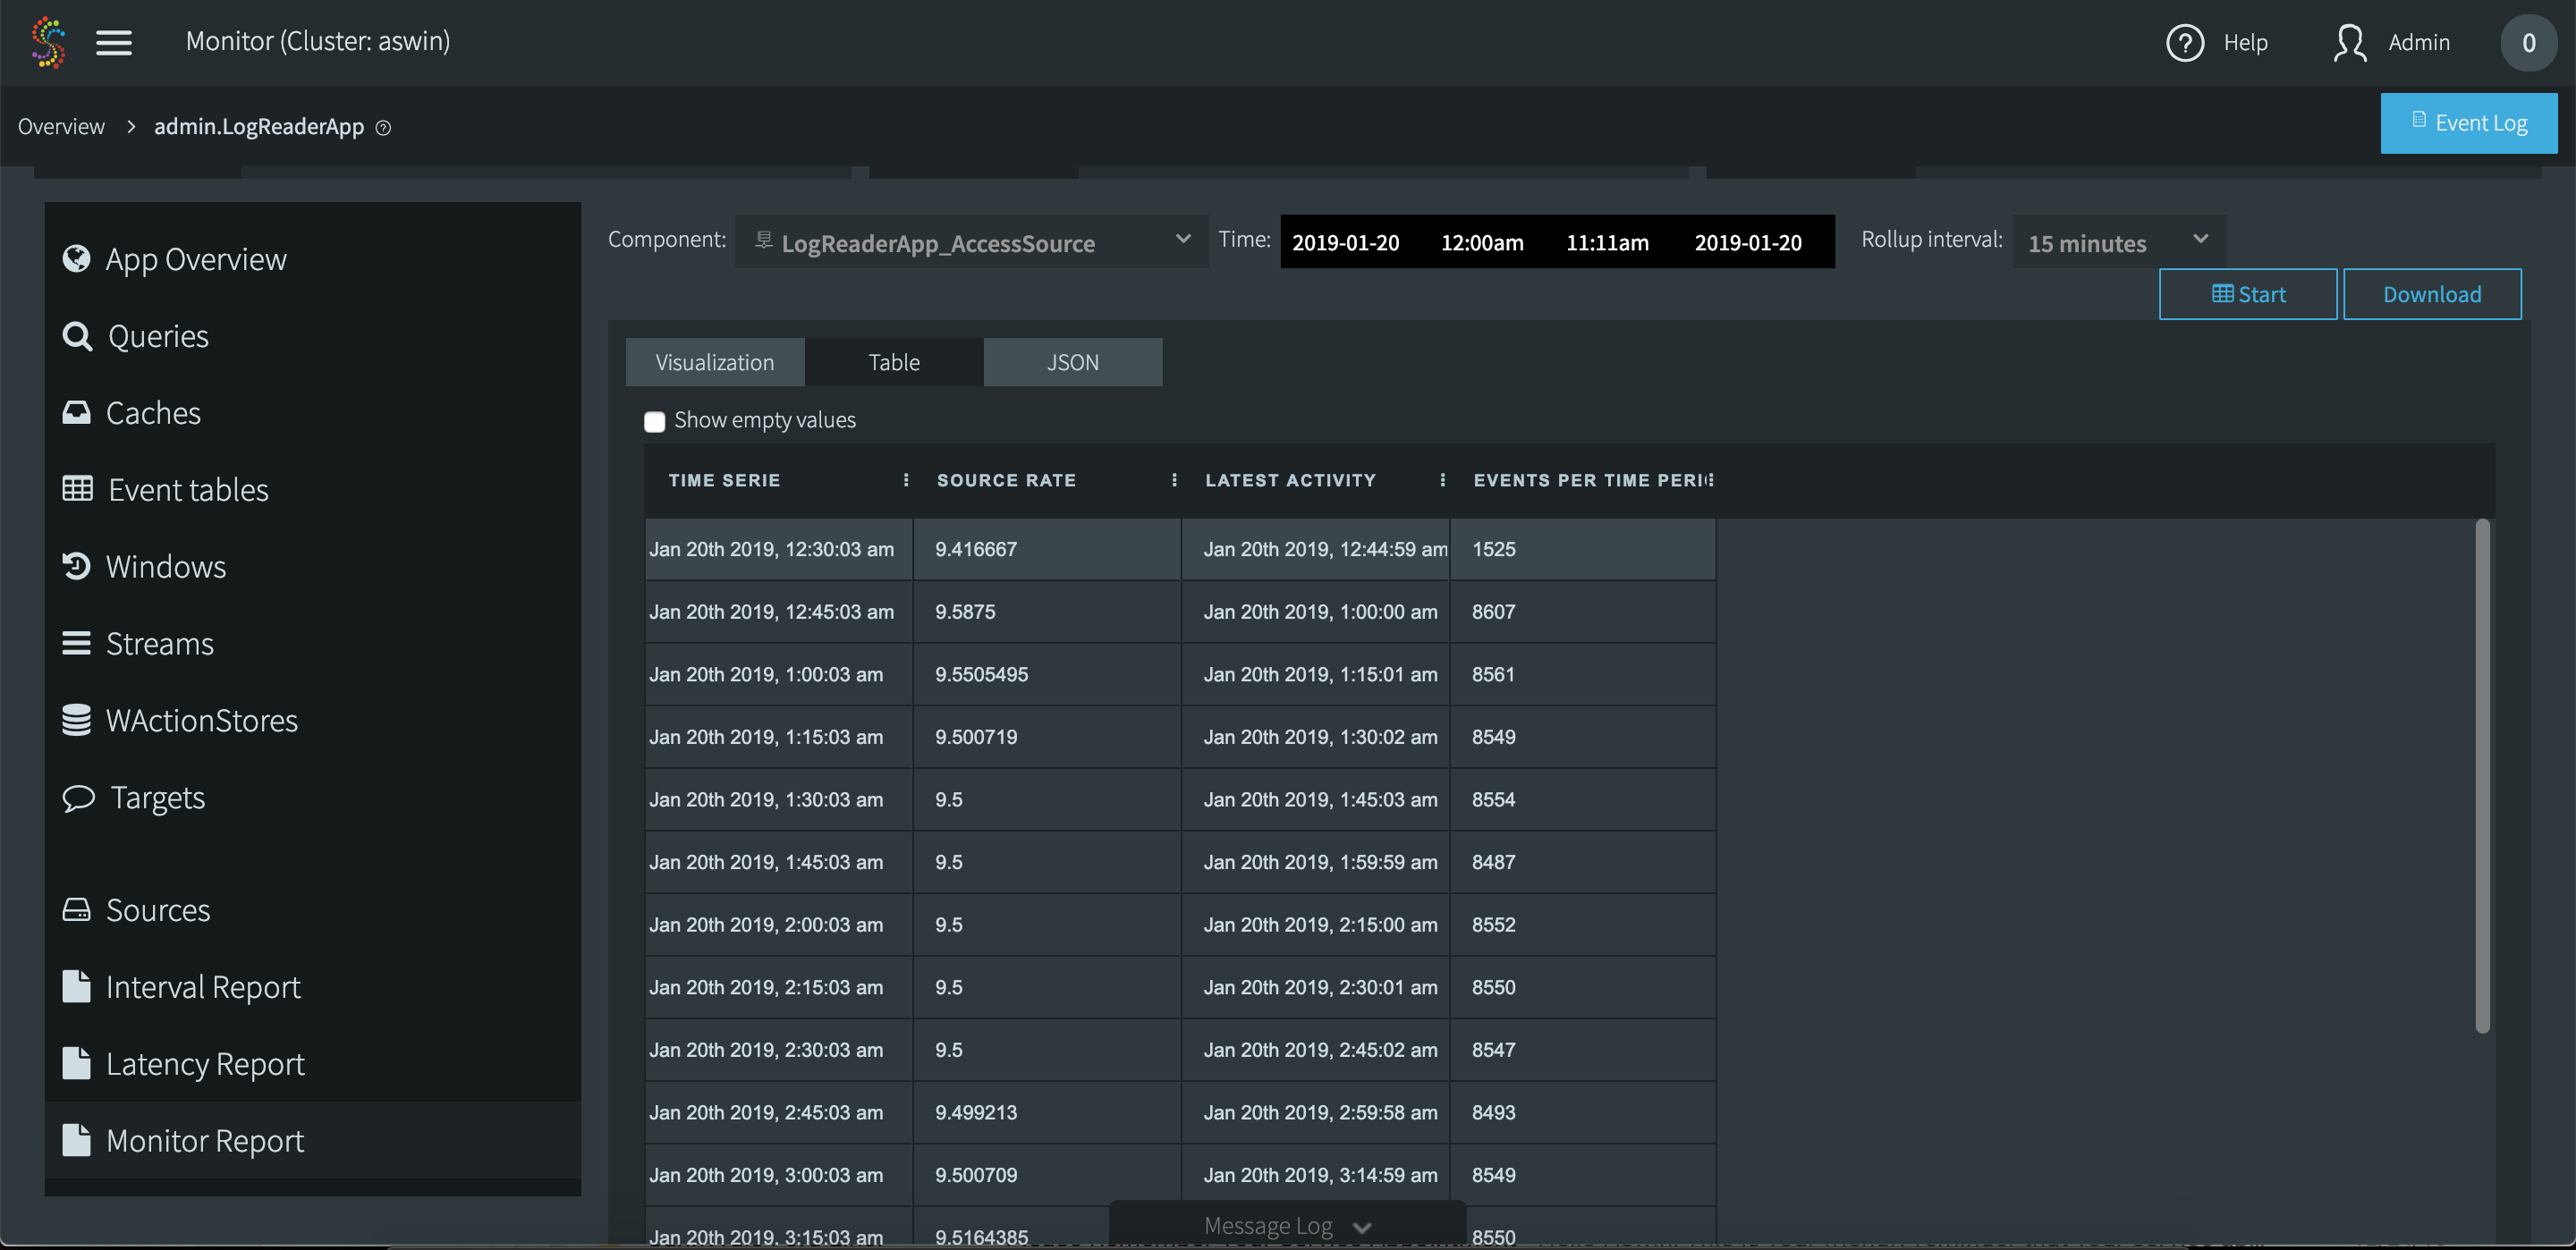
This is the same report in the table view. Click Download to get this information in a comma-delimited file.
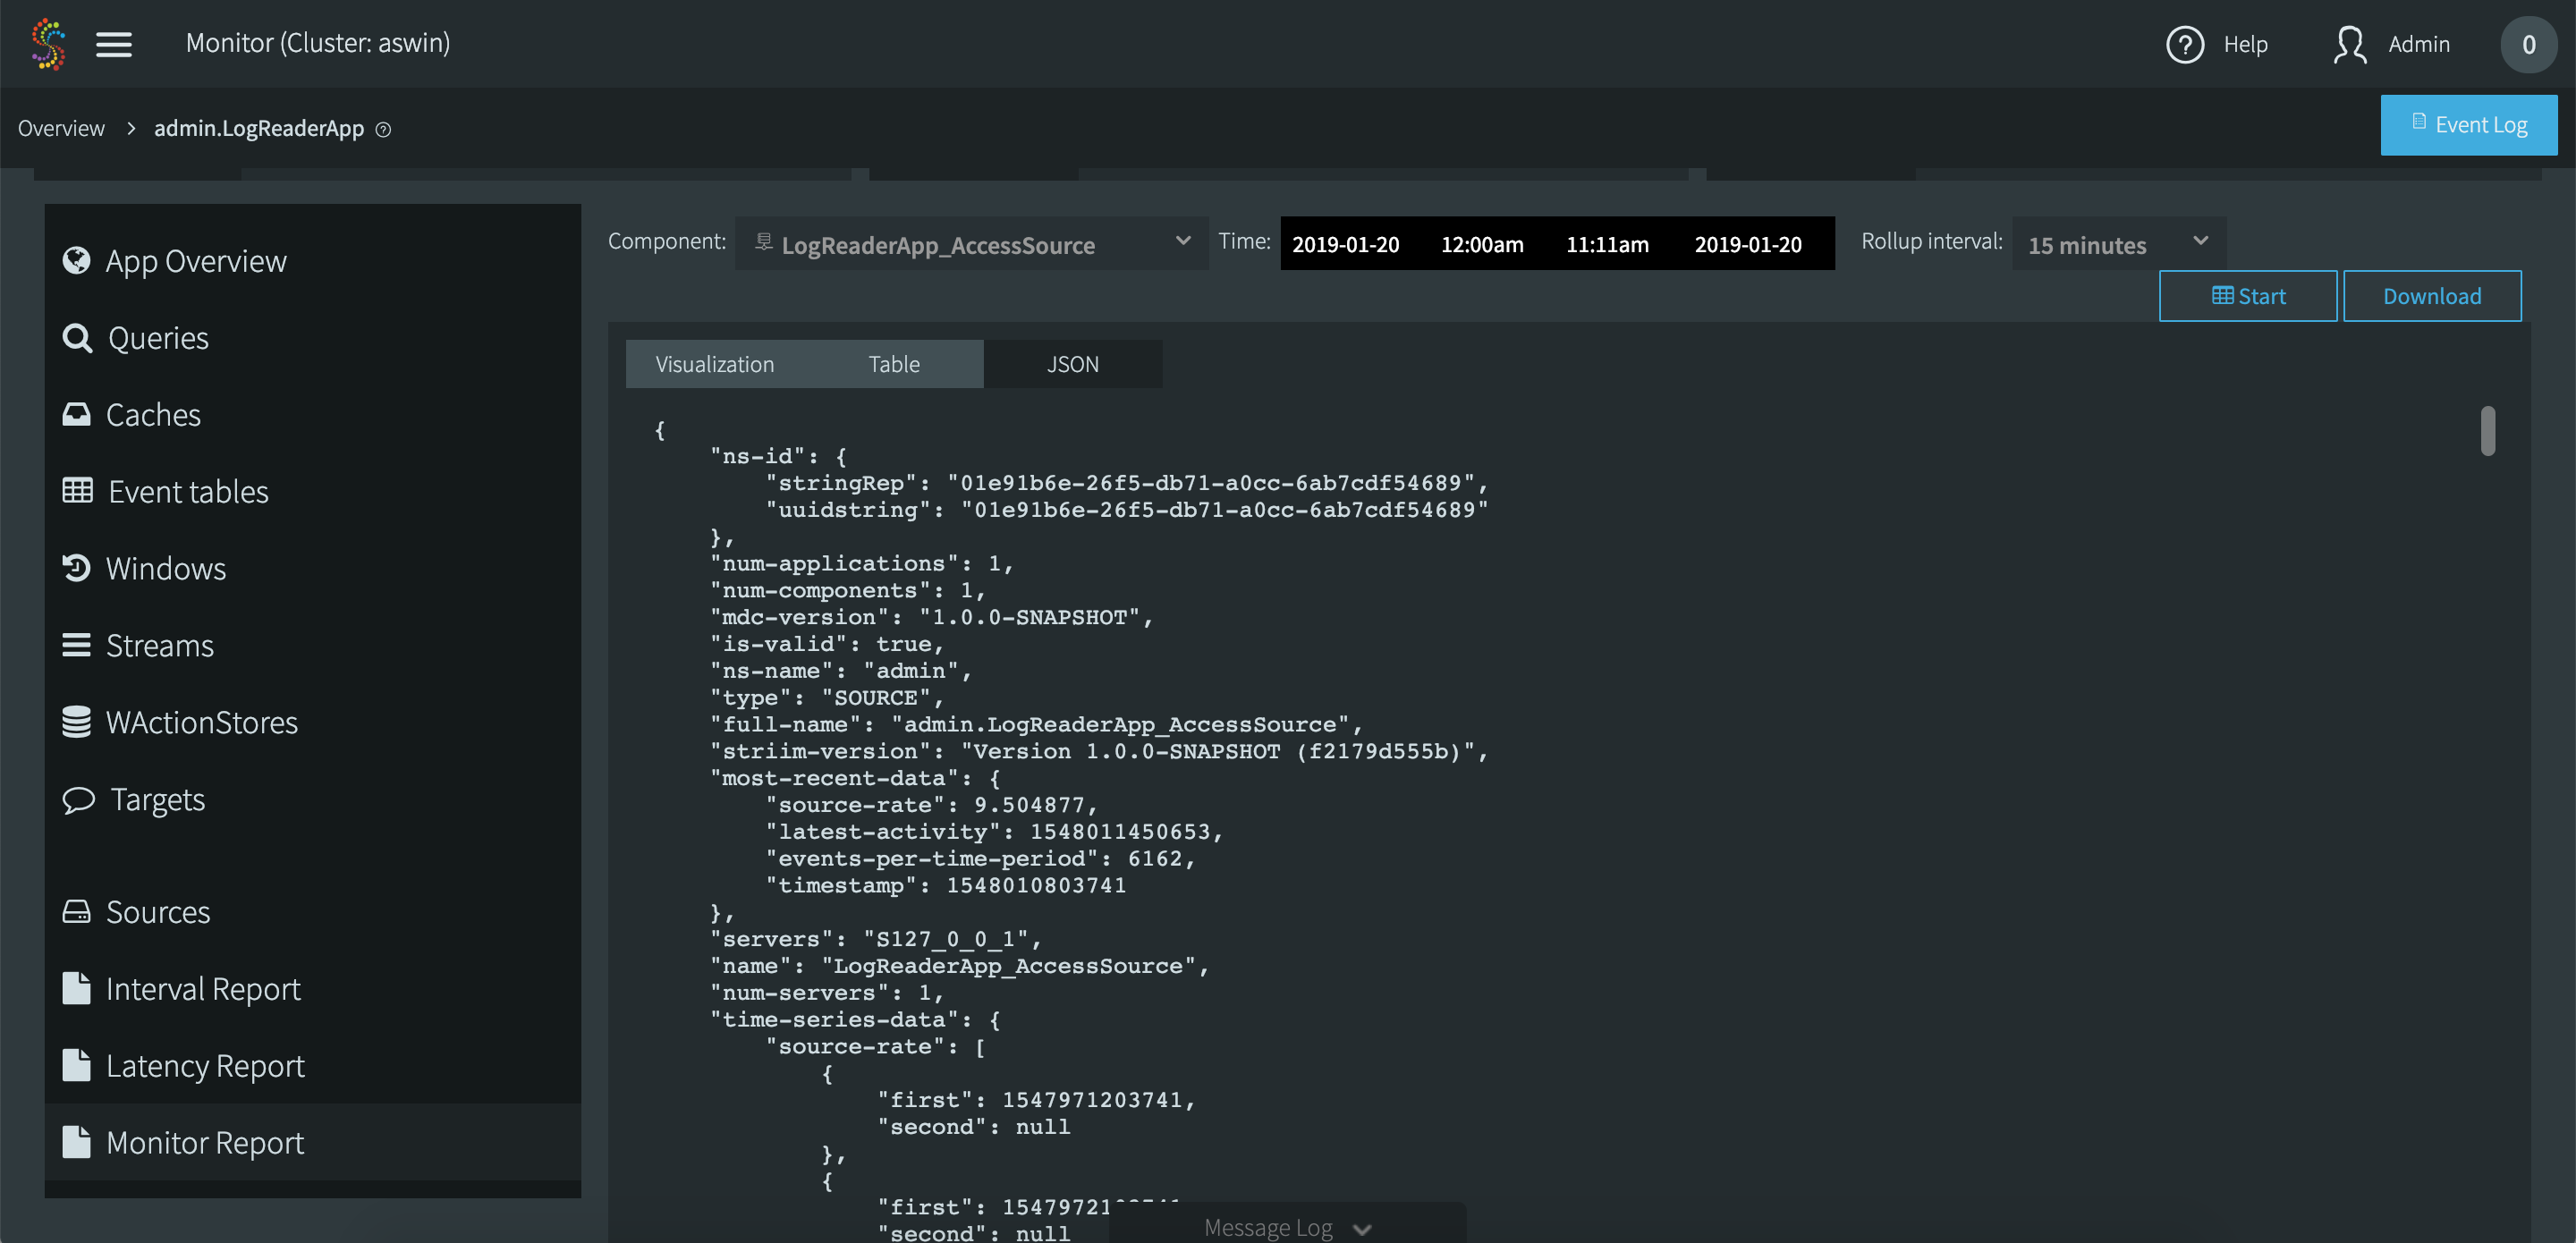
This is the same report in the JSON view.