Monitoring using the web UI
The Monitor page in the web UI displays summary information for the cluster and each of its applications, servers, and agents.
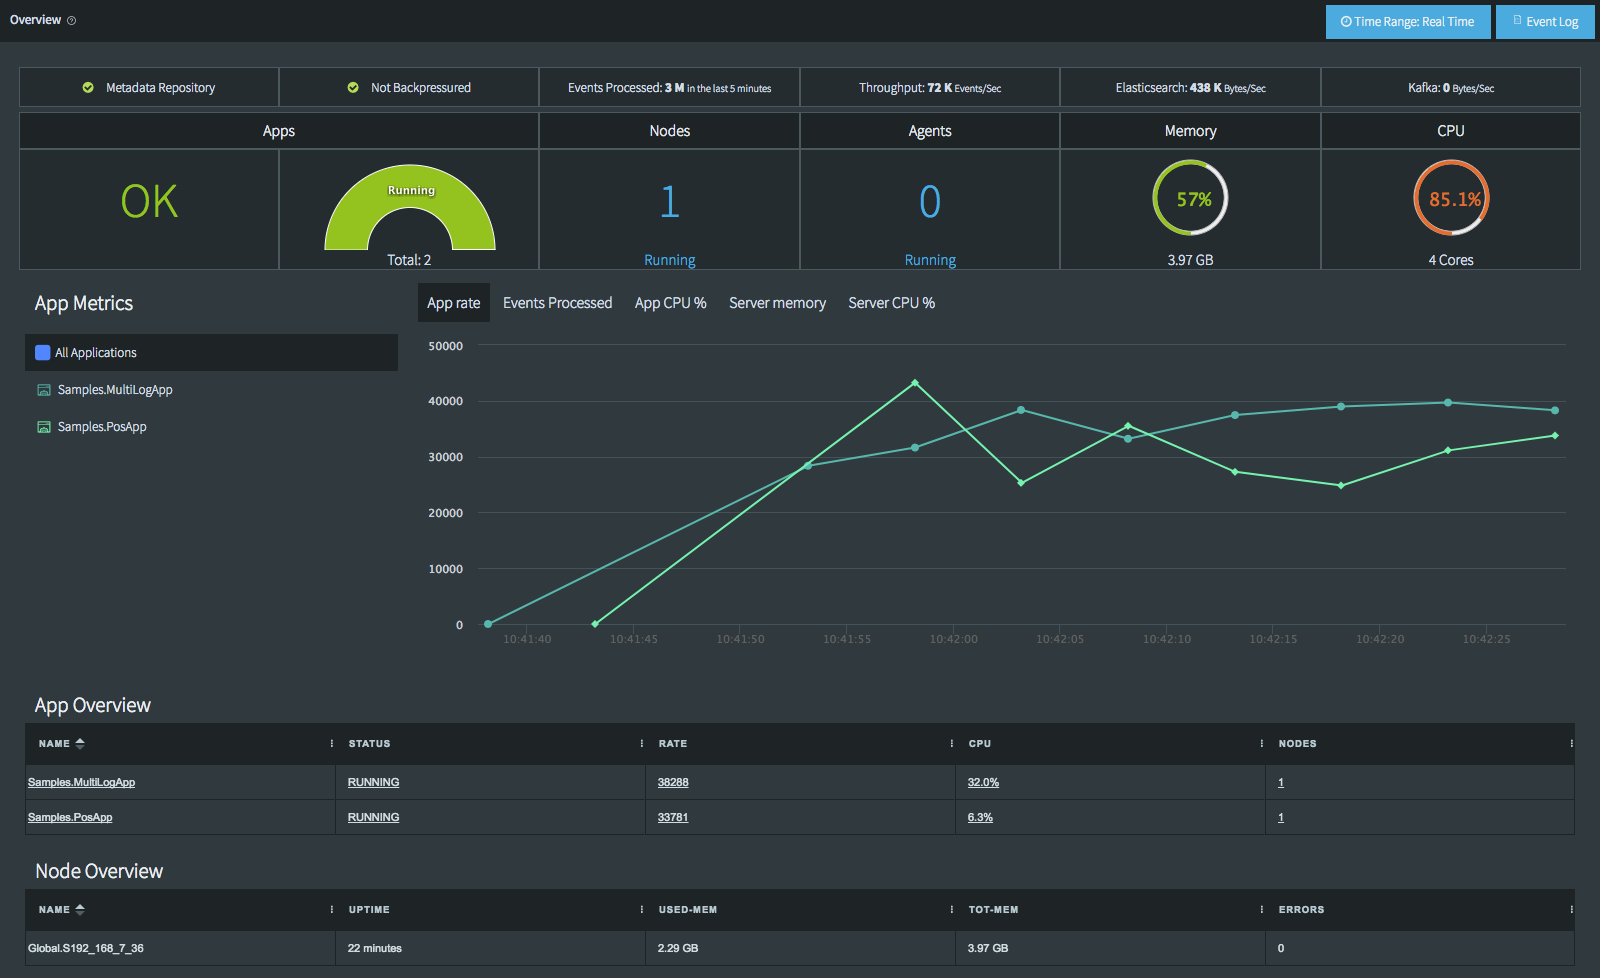
Above, you can see that two applications are running.The display is showing the App Rate (events per second). Click Events Processed, App CPU%, Server Memory, or Server CPU% to graph those statistics instead.
By default, the Monitor page displays the most recent data. To look at older data, click Time Range > Specific Time and select a date and start time.
The S in the name in the Node Overview list indicates that the node is a regular server (S) rather than a Forwarding Agent (A).
To monitor an individual app, click its name in the Apps Overview list or select Monitor App from the app's ⋮ menu on the Apps page.
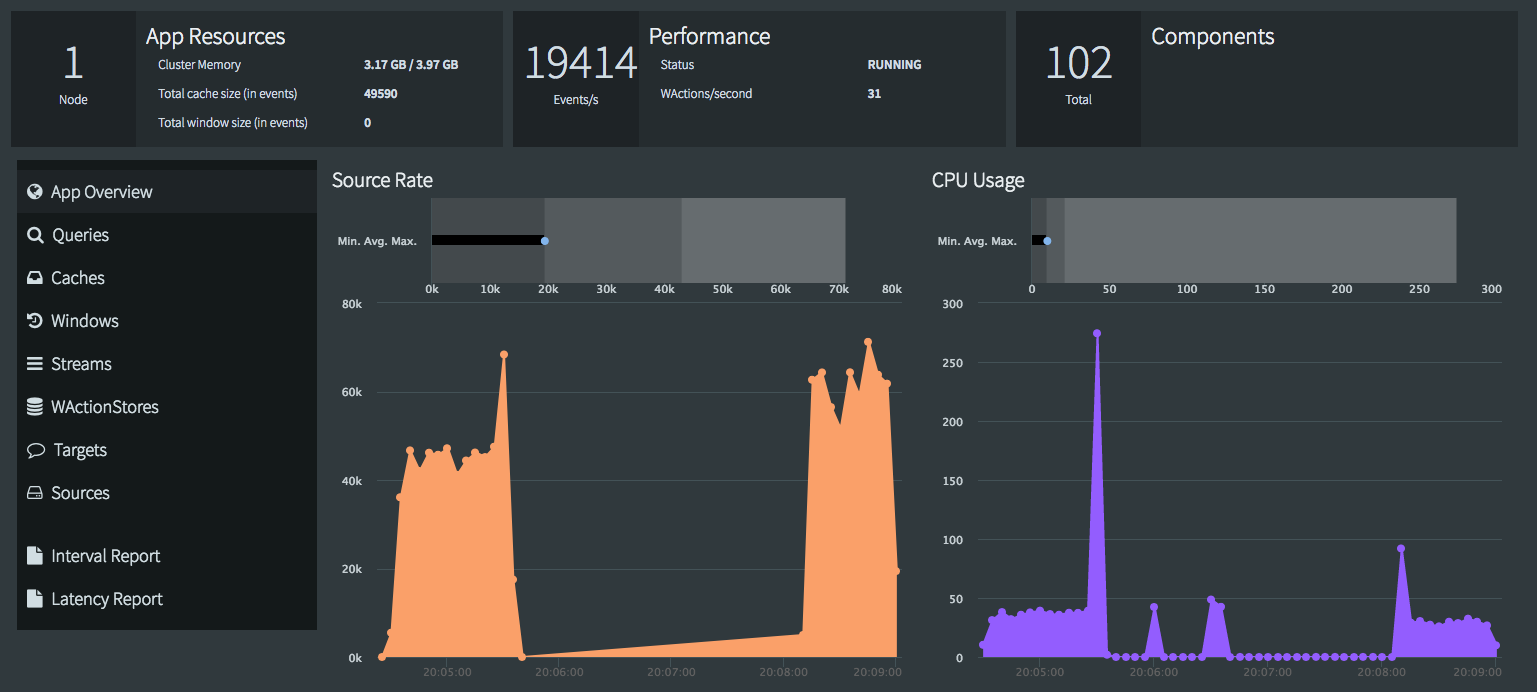 |
Interval Report provides access to the REPORT START and REPORT STOP commands through the UI (see Using the REPORT START / STOP command). For details about Latency Report, see Using the REPORT LATENCY command.
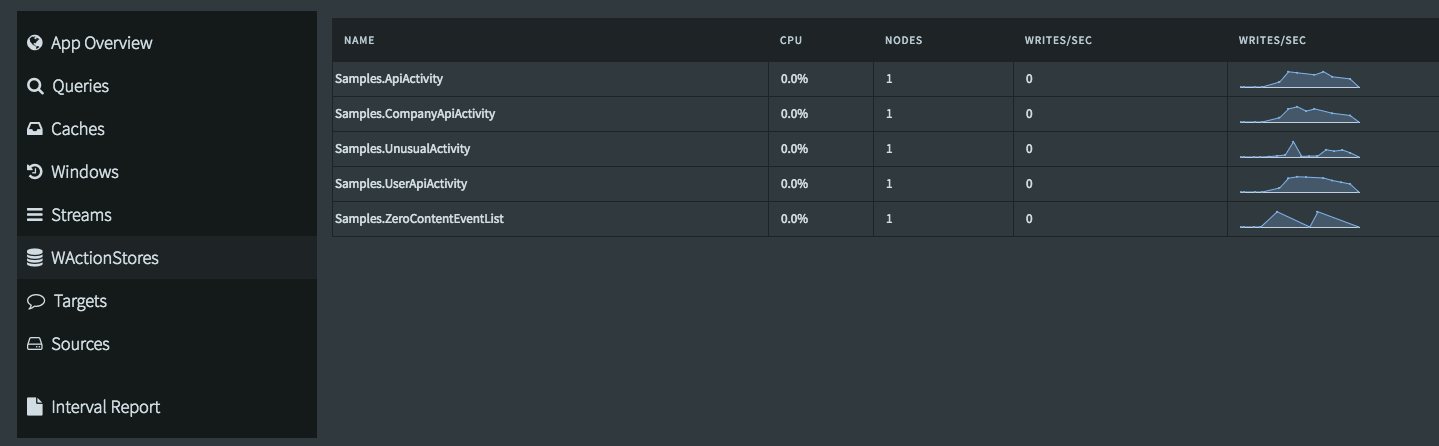
Click one of the buttons at left to see statistics for components of a particular type:
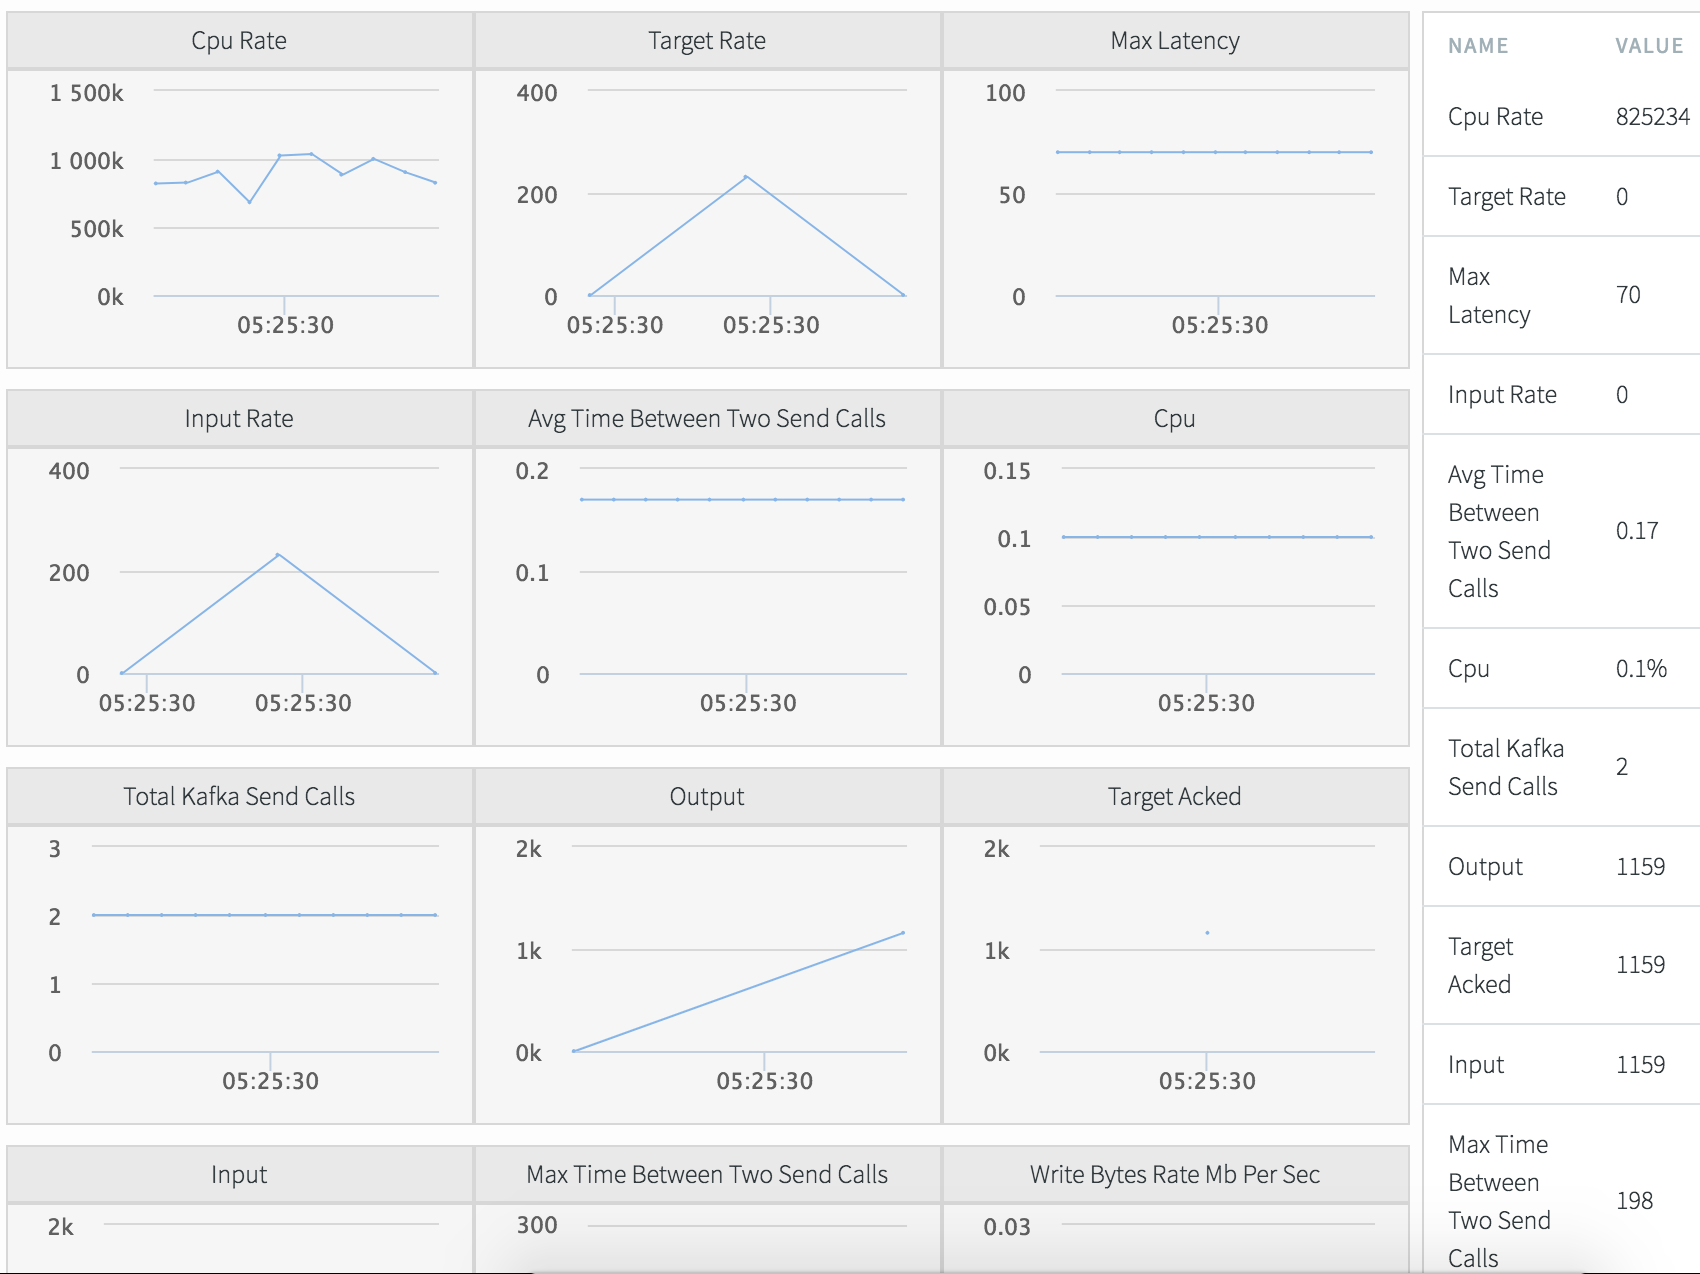
When you see a More Details button, you can click it for more detailed information. For example, for KafkaWriter, you will see something like this:
Click Event Log to see application-related errors and status changes for all nodes in the cluster. Status changes include an app being loaded, deployed, started, stopped, and undeployed, but not dropped.
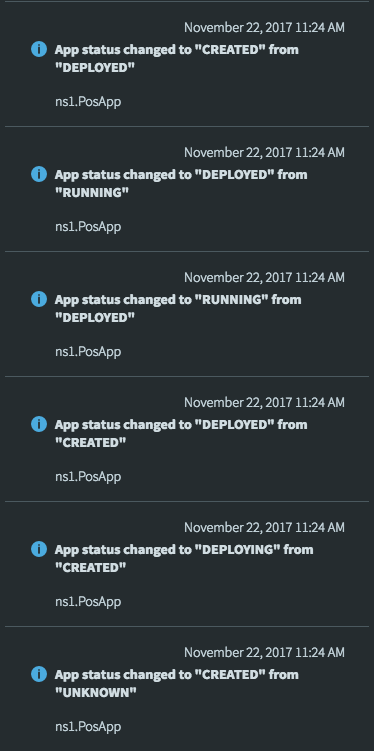
By default, the event log shows status changes and errors for the past five minutes from all nodes (there may be a delay before they appear). Use the filter drop-downs to select a narrower set of data. If you choose a time range, the event log will not be updated with new events until you clear the filter.