Iceberg Writer operational considerations
If partitioned tables are required (see Partitioning in the Iceberg documentation), auto schema creation cannot be used, the tables must be created manually in Iceberg.
Time source data types are written as strings in Iceberg.
When Striim does not report Dataproc errors in detail, look at the Dataproc cluster's Spark logs.
Iceberg Writer best practices
Dataproc performance can be improved by adding worker nodes.
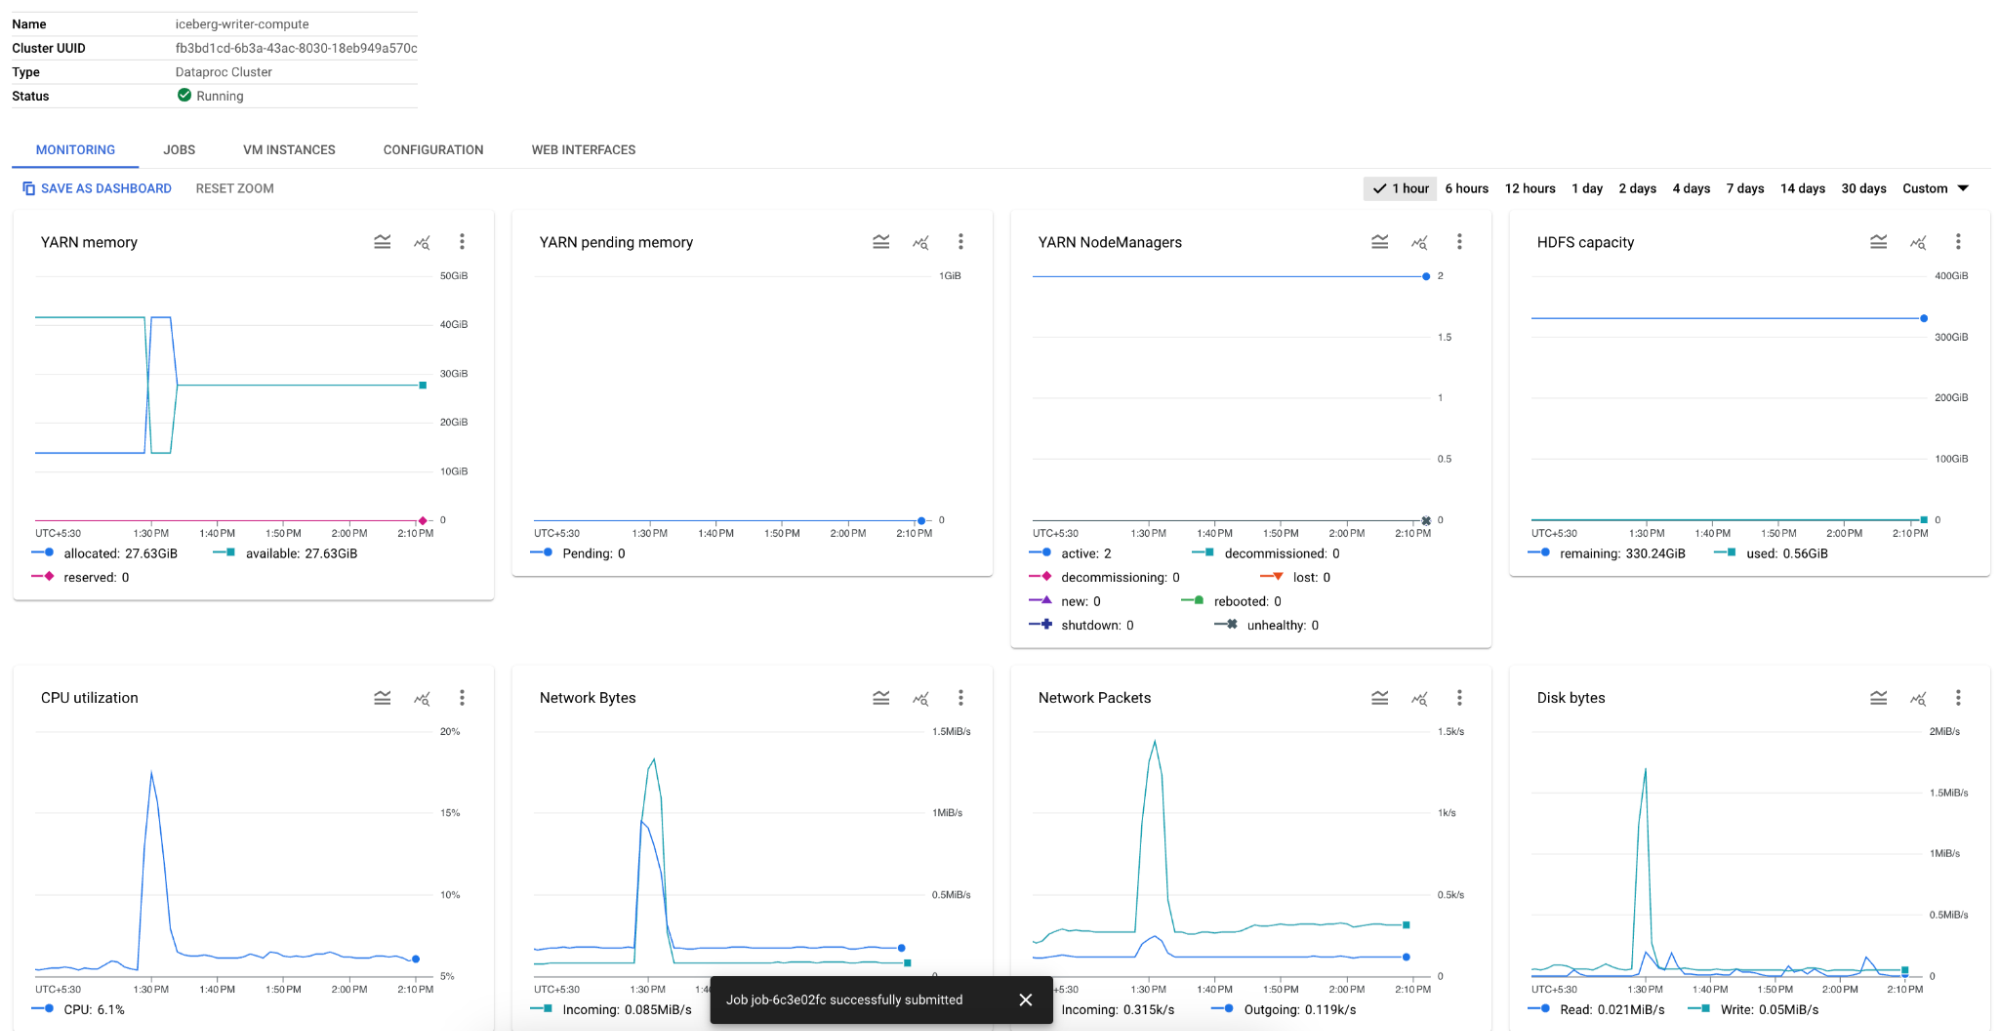
Monitoring Iceberg in Google Cloud
To monitor Dataproc, go to your Dataproc cluster home page in Google Cloud Console and select the Monitoring tab.
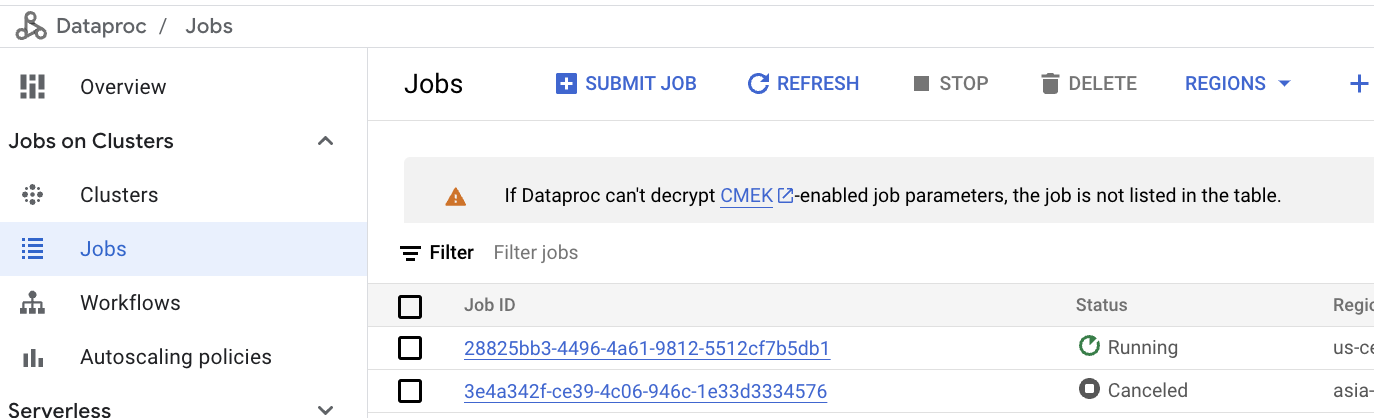
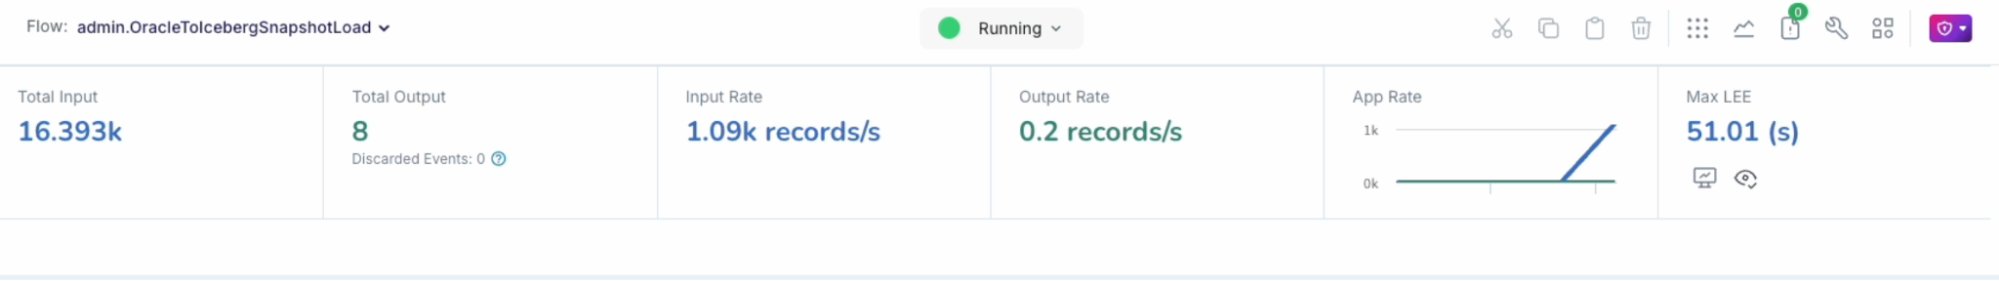
To monitor Dataproc jobs, click Jobs on the left of the cluster home page.
To access Dataproc's Spark services, select the Web Interfaces tab.
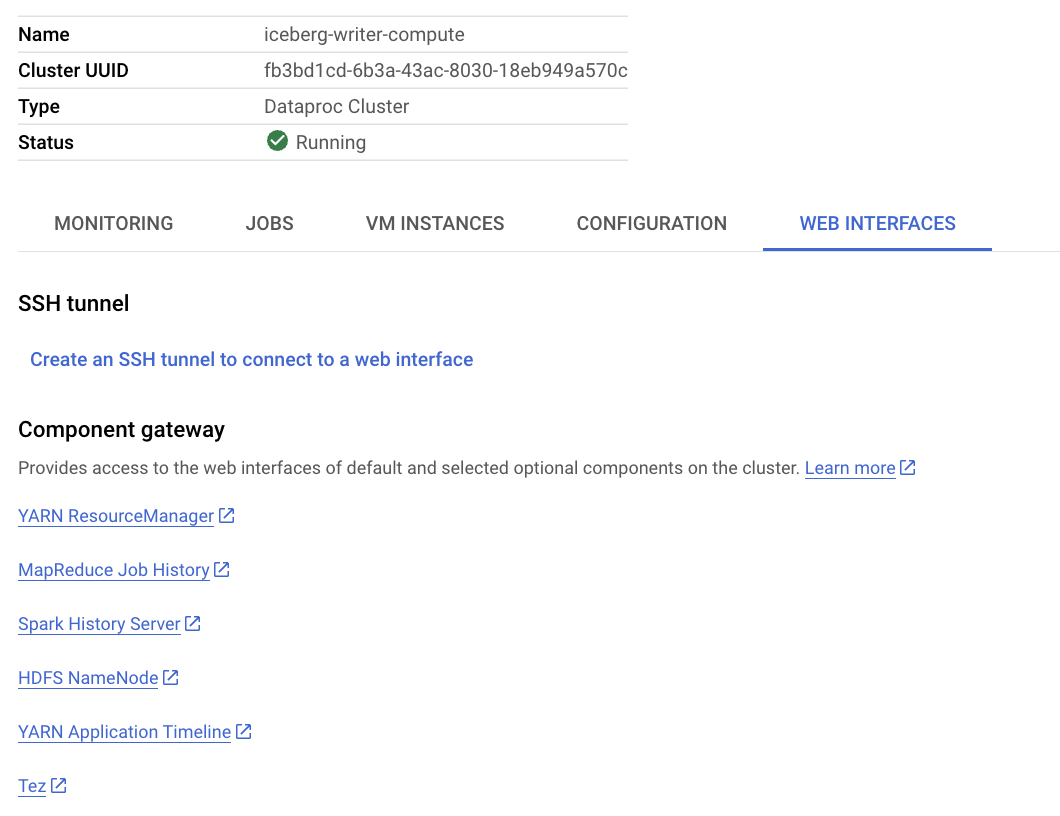
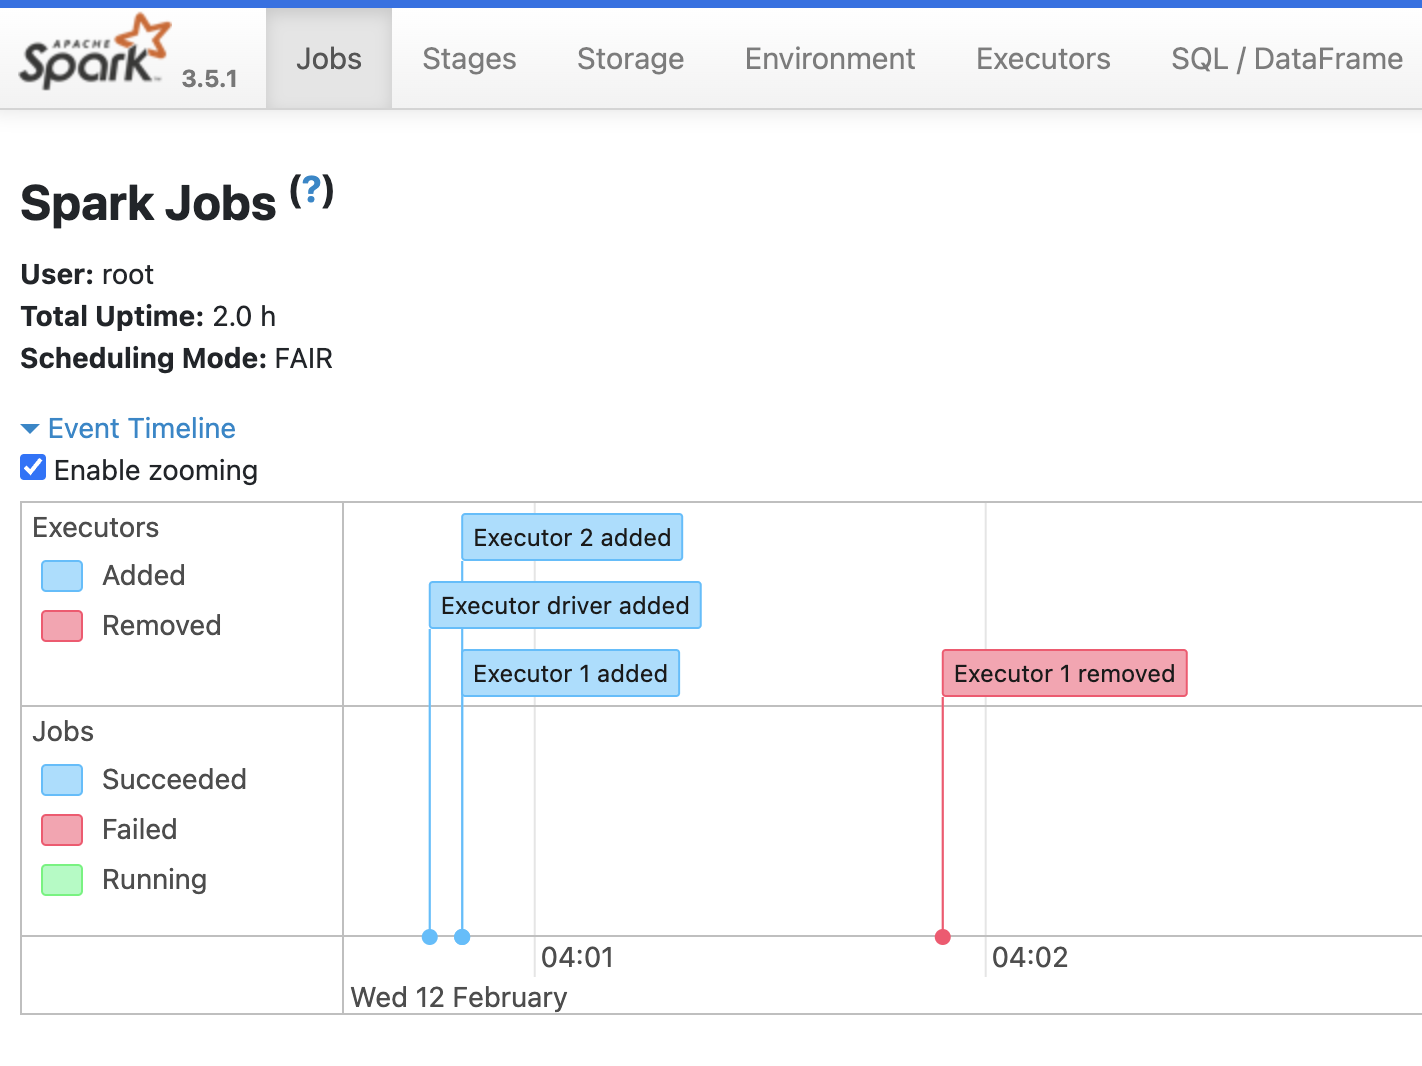
To monitor Spark jobs, click Spark History Server in the Web Interfaces tab.
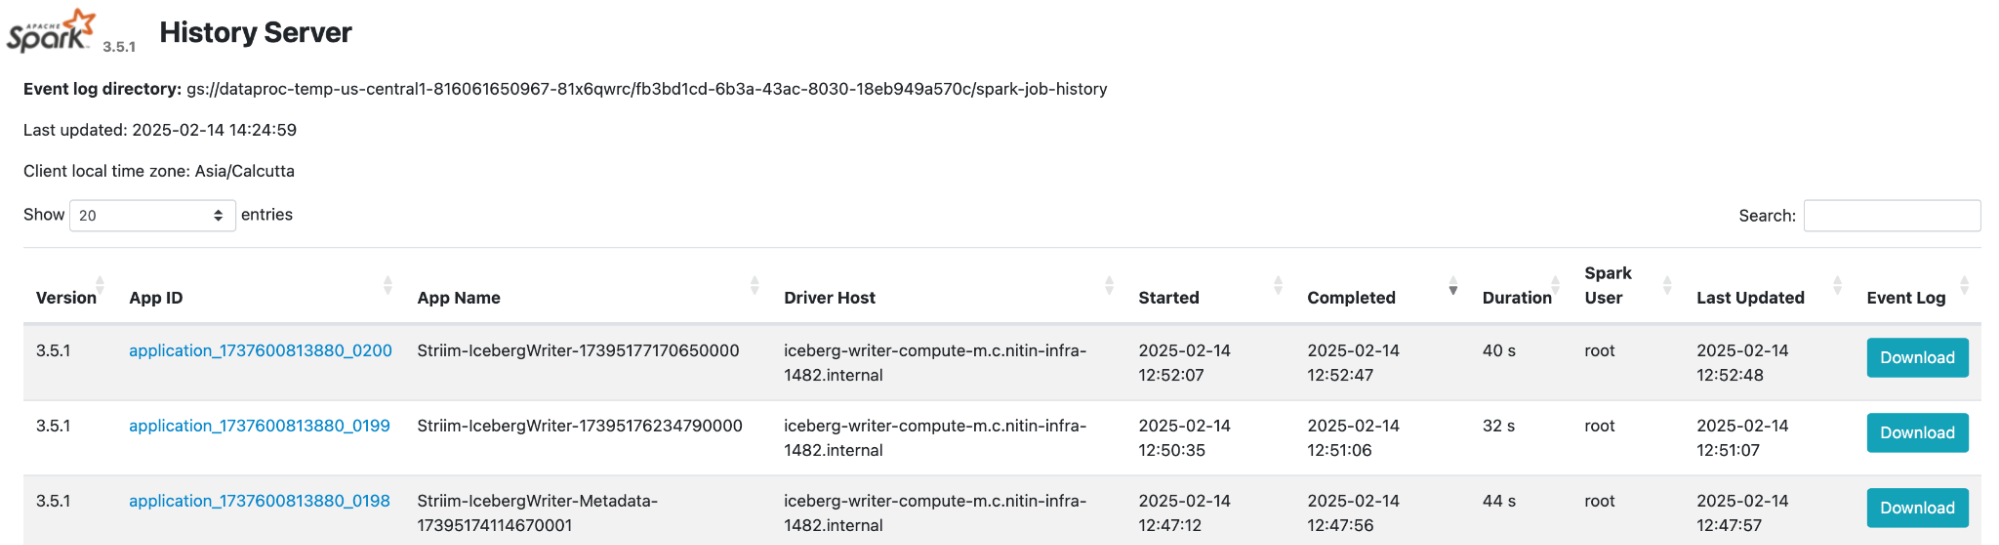
Click one of the jobs to view details about it.
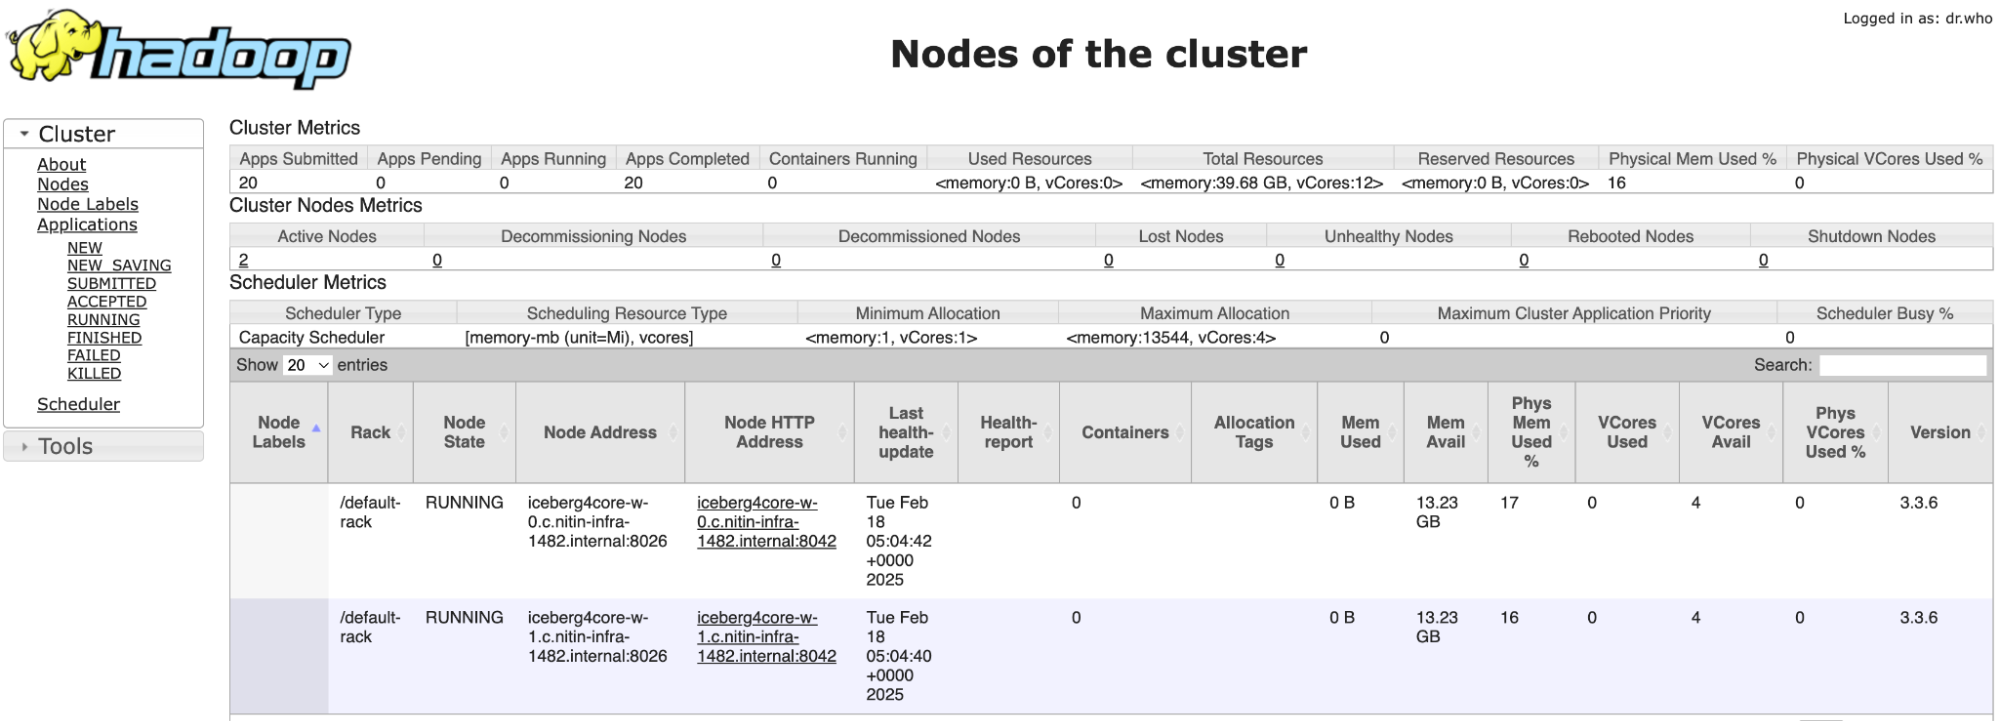
To moniitor Yarn, click Yarn Resource Manager in the Web Interfaces tab.
Troubleshooting Iceberg Writer
See Dataproc > Documentation > Guides > Troubleshoot VM out-of-memory errors and Troubleshoot job delays.
Dealing with backpressure
If Iceberg Writer exhibits backpressure (see Understanding and managing backpressure), you may need to adjust the upload policy or add worker nodes to the Dataproc cluster.
Iceberg Writer load is not progressing
When Iceberg Writer appears to have stalled, open the Striim console and run the show <namespace>.<Iceberg Writer name> status; command to get the Dataproc job ID, then in Google Cloud Console open the Dataproc job details page for that job. If the status is RUNNING but there are no entries in the log, that indicates that there is not enough memory in the Dataproc master node to start the execution of the job. Cancel other Dataproc jobs that are no longer needed, or switch to a Dataproc cluster with a master node with more memory.
If the logs contain multiple entries of WARN YarnScheduler: Initial job has not accepted any resources; check your cluster UI to ensure that workers are registered and have sufficient resources, that indicates that the underlying Spark engine is unable to find enough executors to execute the current batch operation. Add additional worker nodes to the cluster or switch to a Dataproc cluster with worker nodes that have more vCPUs and memory.
Using the SHOW command with Iceberg Writer
Use the SHOW command to get information about Iceberg activity in Google Cloud.
SHOW <namespace>.<Iceberg Writer name> STATUS;
Displays the status and details of the latest 20 DataProc jobs associated with the specified IcebergWriter component. Will be reset when the application is undeployed. Entries are ordered by execution time in descending order, with the most recently executed job displayed first. The following information is included in the output.
Compute Type: The execution environment used (e.g., Dataproc).
Job ID: Unique identifier assigned to the DataProc job which is used by the application.
Job State: Current status of the job – e.g., RUNNING, STOPPED, FAILED, etc.
Spark Application Name: The name of the Spark application associated with the dataproc job.
Retry Count: Number of times the job retried a specific task due to failures.
Log URL: URL to view the job’s logs for troubleshooting and analysis.
Batches Processed: Number of batches successfully processed by the job
SHOW <namespace>.<Iceberg Writer name> STATUS DETAILS;
Displays the last 10 executed batch details irrespective of the table. Will be reset when the application is undeployed. Entries are ordered by execution time in descending order, with the most recently executed batch displayed first. The following information is included in the output.
Batch (TableName-SeqNo): Identifier for the batch, including table name and batch sequence number.
Spark Application Name: Spark application name associated with the dataproc job that successfully completed the batch.
Failed Spark Applications: Comma-separated list of Spark application names that failed before the successful execution.
Spark Metrics: Execution stats (e.g., total jobs run, time taken) in a JSON-like format.
Last Executed Job ID: ID of the final job that successfully executed this batch.
Previous Job IDs: Comma-separated list of job IDs that attempted this batch prior to the last successful execution, ordered with the most recent first.
The Spark Metrics column contains the following metrics as a JSON string.
Metric Name | Description |
|---|---|
totalJobs | Total number of Spark jobs executed for the batch |
distinctExecutors | Total number of distinct Spark executors that were assigned to run this job |
jobTotalTimeMs | Total time (in milliseconds) taken by the Spark jobs at executors and driver to run this batch |
executorRuntimeMs | Total time (in milliseconds) taken at the Spark executors to run this batch. |
executorCpuTimeNs | Total time (in nanoseconds) taken at the Spark executors CPU. |
jvmGcTimeMs | Total time (in milliseconds) taken by Java Garbage Collector at the Spark executors during the execution of the batch. |
maxPartitions | Total number of distinct partitions that the batch was split for processing. |
maxJobStages | Total number of job stages that the batch was split for processing. |
totalTasks | Total number of tasks that the Spark jobs were split into for processing. |
SHOW <namespace>.<Iceberg Writer name> STATUS DETAILS - TABLE <table name>;
Displays the last 10 batch details for a specific table. Will be reset when the application is undeployed. Entries are ordered by execution time in descending order, with the most recently executed batch displayed first. The following information is included in the output.
Batch (TableName-SeqNo): Identifier for the batch, including table name and batch sequence number.
Spark Application Name: Spark application name associated with the dataproc job that successfully completed the batch.
Failed Spark Applications: Comma-separated list of Spark application names that failed before the successful execution.
Spark Metrics: Execution stats (e.g., total jobs run, time taken) in a JSON-like format.
Last Executed Job ID: ID of the final job that successfully executed this batch.
Previous Job IDs: Comma-separated list of job IDs that attempted this batch prior to the last successful execution, ordered with the most recent first.