Monitoring the status and health of Striim servers
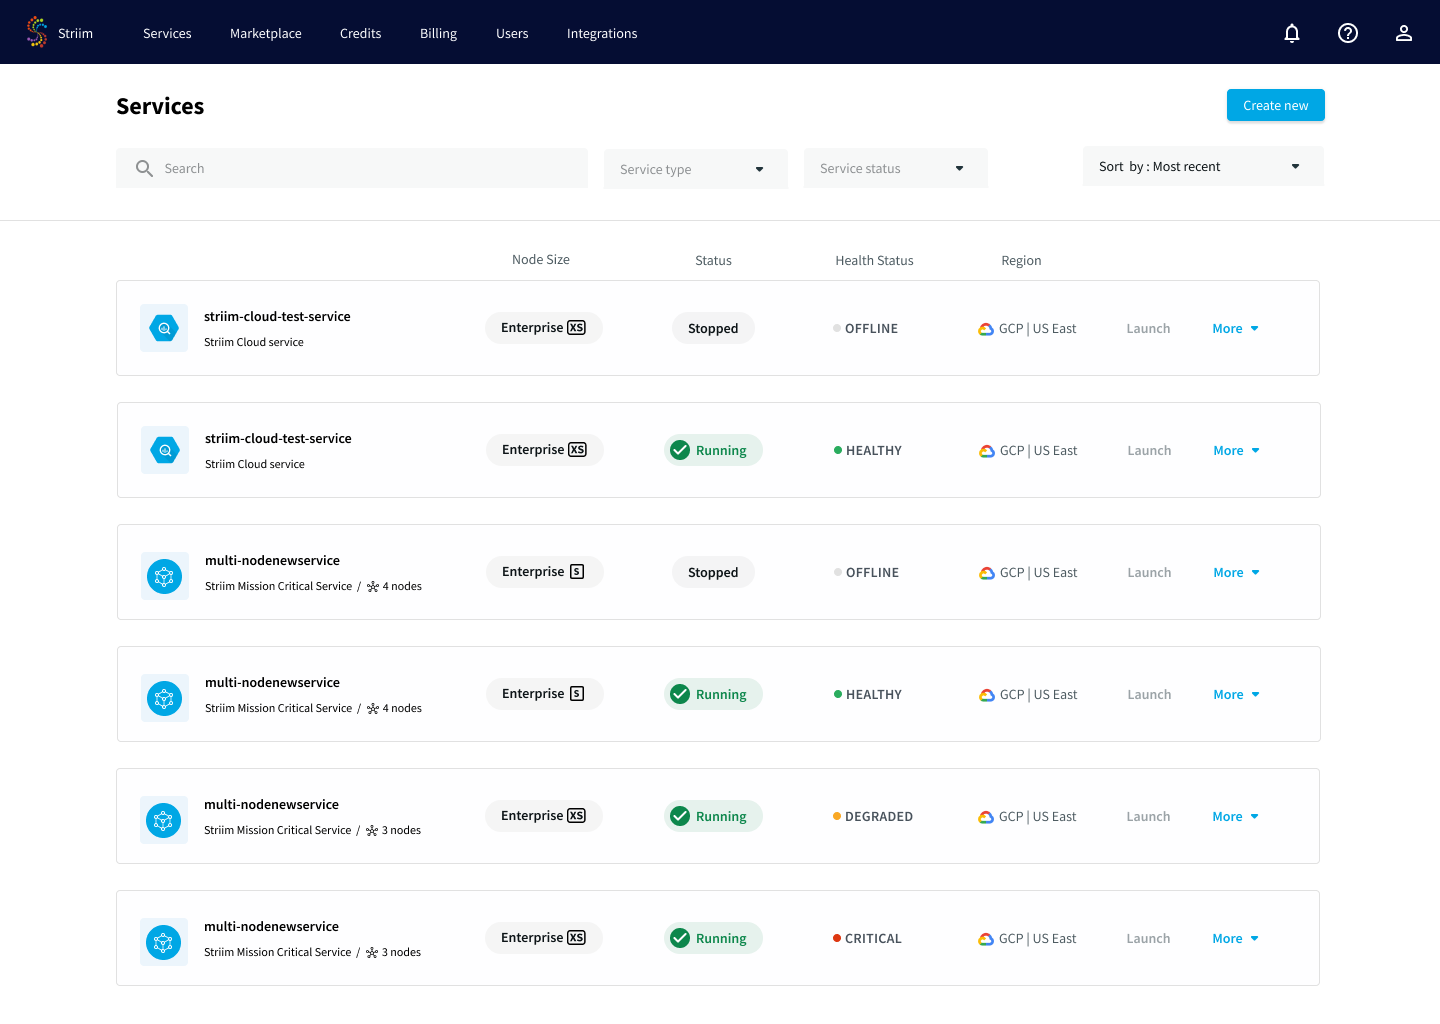
Certain Striim solutions such as Striim Cloud Mission Critical provide tools to deploy and run applications on multiple servers for higher performance or availability. Monitoring the health of the cluster and individual Striim servers allows you to plan application deployments accordingly. You can quickly see the overall health of the cluster through the Status and Health Status columns.
Health status
The following are the possible status for the Health Status column:
Healthy: The Striim cluster is operating normally. All user-specified Striim servers are running.
Degraded: Some nodes in the Striim cluster are not working properly, but the cluster performance is not affected. Striim staff is investigating. Numerically, this status is shown when at least one node is down but the number of running nodes is above half those specified by the user.
Critical: There are insufficient healthy nodes for cluster performance. Expect increased processing latency. Striim staff is actively addressing the issue. Numerically, this status is shown when the number of nodes down is less than half specified by the user.
Offline: The cluster is unavailable. Striim staff is attempting to restore functionality.
Health status indictors are shown only when the service is in the Running state. Striim Cloud Mission Critical users are not expected to take any corrective action when you see a Degraded, Critical, or Offline health status. Striim is notified about the degradation and will investigate the issue.
Single server Striim solutions display only the Healthy or Offline statuses.
Service status
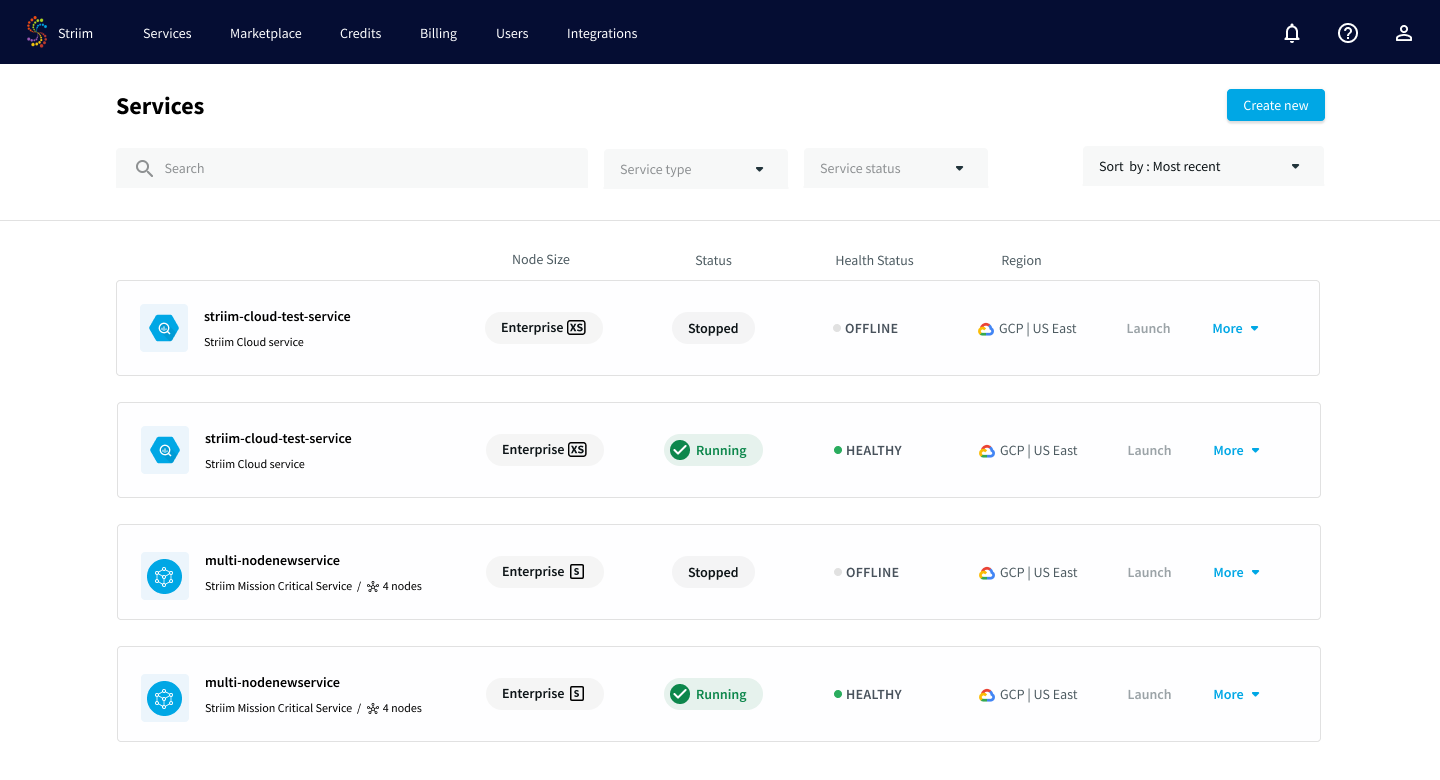
By comparison, the Status column covers actions under user control. There are the following possible statuses:
Creating: The service is being created.
Starting: The service has been created and is starting.
Running: The service is running.
Stopped or Stopping: The service has been stopped by the user, or is in the process of stopping.
Upgrading: The service is being upgraded.
Resizing: The service is being resized to have more Striim servers or to increase the capacity of the VM used.
Using observability tools with Striim Cloud
Striim Cloud exposes application metrics that you can process with your existing third-party observability tools, such as Dynatrace. Striim uses an Open Telemetry collector to export metrics from Striim Cloud to a telemetry backend. You can leverage your observability tools to help monitor and analyze the performance of your Striim applications in the Striim Cloud environment. By analyzing the data you can gain insights into application performance and reliability, and make any necessary changes to your application to improve performance.
The following observability tools are currently supported:
Dynatrace
Google Managed Service for Prometheus (GCP only)
New Relic
Prometheus Remote Write
Endpoint URL formats
Use the following endpoint URL formats when configuring each observability tool.
Observability tool | Endpoint URL format |
|---|---|
Dynatrace |
|
Not applicable. GMP uses GCP IAM-based authentication instead of an endpoint URL and API token. | |
New Relic |
|
Prometheus Remote Write |
Use the Grafana Cloud or Prometheus-compatible endpoint assigned to your environment. |
Configuring an observability tool
The Striim admin can configure an observability tool at the account level, and add new observability tools as they are supported. Users can choose to use an observability tool with an existing service or while creating a new service. The metric data will then be streamed into the associated observability tool. For example, your Striim admin can configure Striim by associating your Striim Cloud service with your Dynatrace account. Your users can then choose to use the tool with both existing or new services.
To configure an observability tool at the account level (Striim admin) and associate it with a service:
The Striim admin navigates to the Services page.
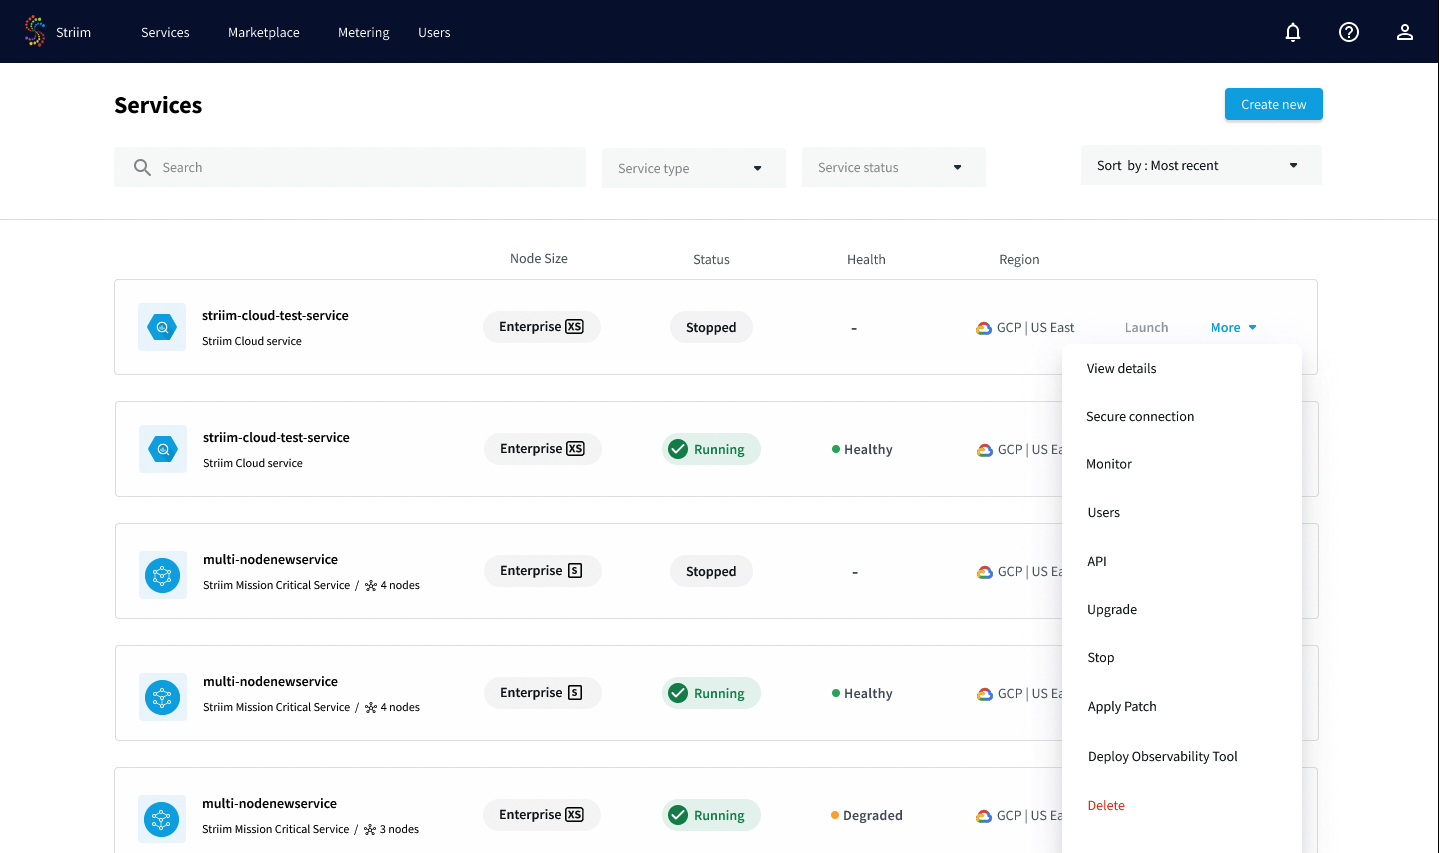
From the Services page, the Striim admin selects More and Deploy observability tool from the More menu of a service.
If there are no tools configured, click Add to configure a new tool. Or create a new tool from the Observability tools page.
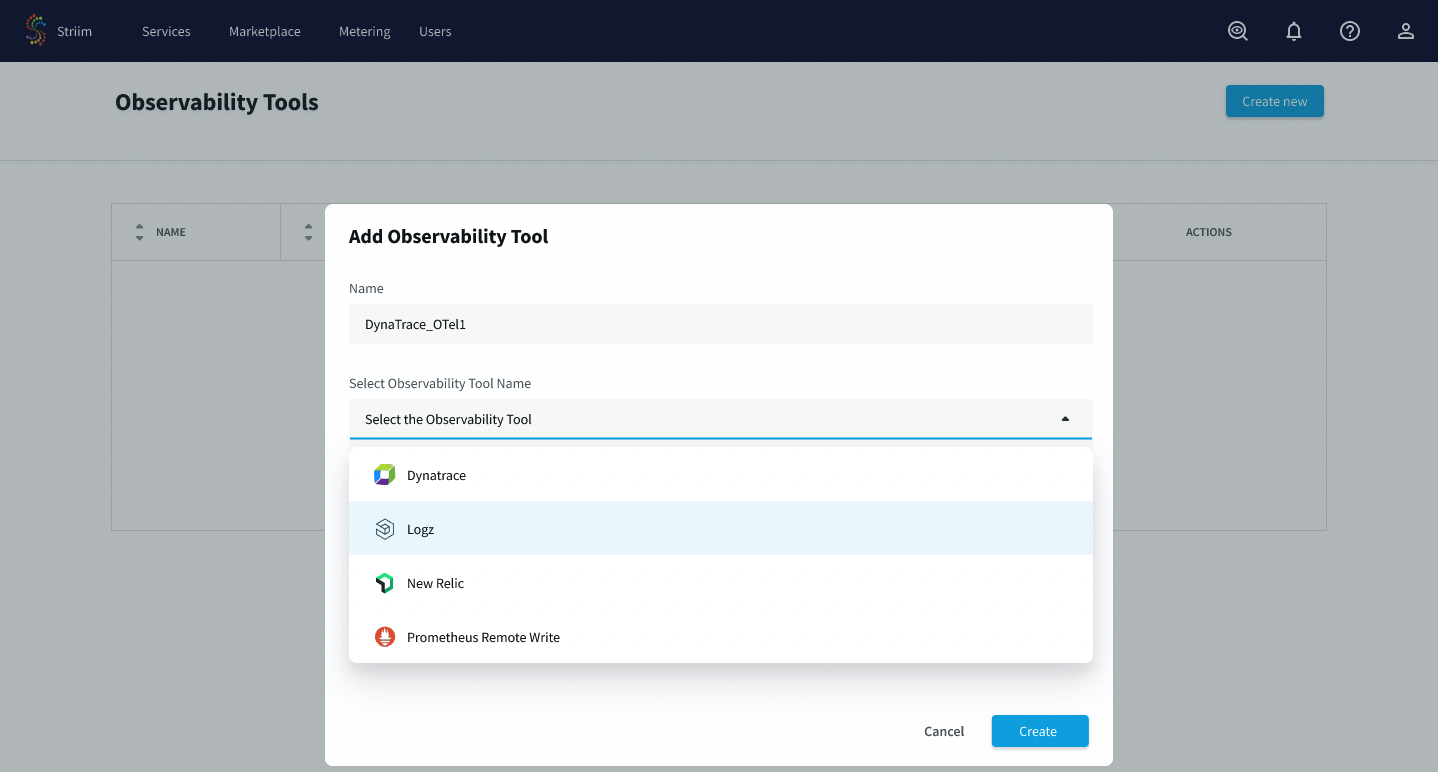
Specify the following configuration for the tool:
Name: a description name for your tool. You will be specifying this name when associating the tool with Striim service(s).
Select observability tool name: choose your tool from the drop down menu.
Endpoint URL: The URL for your observability tool endpoint. For example, for Dynatrace the URL of the endpoint is in the form https://example.live.dyntrace.com/api/config/v1/plugins/custom.remote.python.sap/endpoints/<endpoint-id>. For more information, see the documentation for your observability tool.
API token: The API token for sending authenticated requests to your observability tool endpoint.
You can now see the tool appear in the list of observability tools for the account. It can be associated with one or more Striim services.
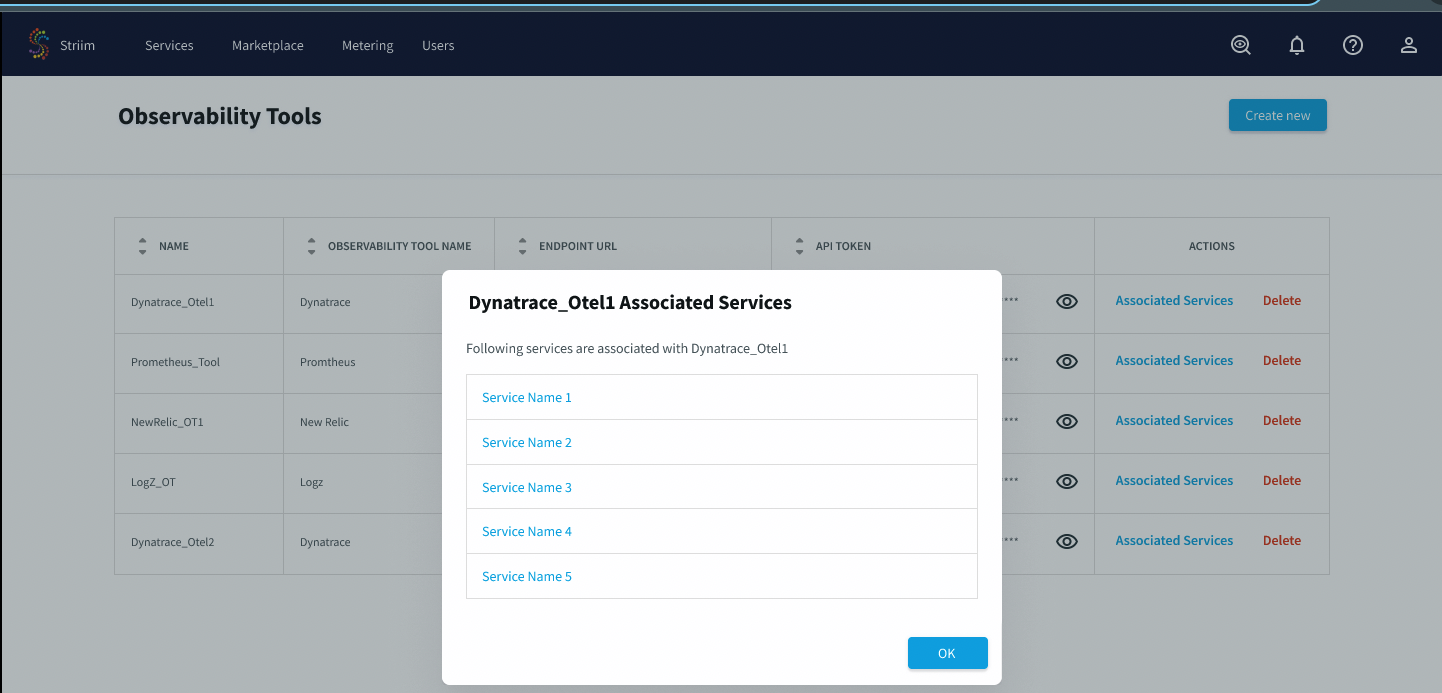
Associating an observability tool with a Striim service
Admins can choose to associate an observability tool with an existing service, or after creating a new service. If there are no available observability tools to deploy, contact your Striim admin.
To associate an observability tool with a Striim service:
The Striim admin navigates to the Services page.
From the More menu of a service, select Deploy observability tool.
Select the observability tool from the drop down menu, and choose Save.
Deleting an observability tool
To delete an observability tool, you must first disassociate the tool from all services.
To do so, select Disassociate observability tool in the configuration for each associated service.
Metrics available to the observability tool
The metrics streamed to the tool include general application metrics, and application metrics for the source and target.
The following general application metrics are sent to the tool.
Note
For more information on monitoring in Striim, see the Monitoring Guide.
Application status
CPU and memory
Disk usage
End-to-end latency
Event count
Application metrics are provided for MongoDB Reader and Azure Event Hub Writer:
Total number of active connections per Azure event hub
Count of request sent per eventhub from an app
Average of messages fetched from a collection
Average number of bytes fetched per request
Partition # of the message sent by event hub
Average time spent for I/O while waiting for available sockets to send the data.
Average number of records in each request per event hub
Average size of all requests in the window for an app
Average per-second number of retried record sends for an event hub
Count of errors due to network failure
Count of errors due to authentication failures
Average per-second number of record sends that resulted in errors for an event hub