


Analyze point-of-sale retail data in real-time with Striim, BigQuery, and the BI tool of your choice.
- Streaming Change Data Capture – Striim
- Streaming Data Pipelines in SQL – Striim
- Streaming Data Visualiztion – Striim
- Cloud Data Warehouse with incremental views – BigQuery
- Reporting & BI – Metabase
Overview
Before following the instructions below, sign up for Striim Developer to run through this tutorial (no credit card required).
In the web UI, from the top menu, select Apps > View All Apps.
If you don’t see PosApp anywhere on the page (you may need to expand the Samples group) , download the TQL from Striim’s GitHub page. select Create App > Import TQL file, navigate to Striim/Samples/PosApp, double-click PosApp.tql, enter Samples as the namespace, and click Import.
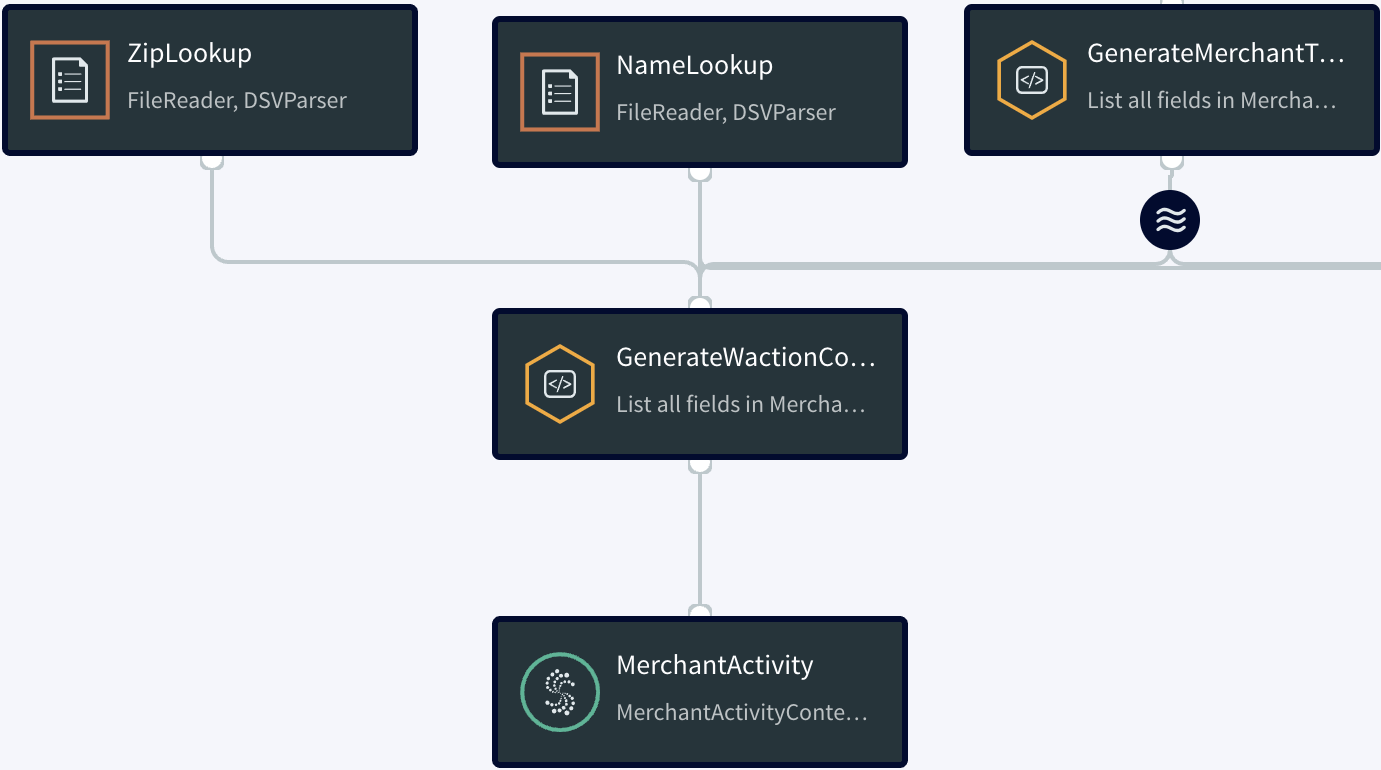
At the bottom right corner of the PosApp tile, select … > Manage Flow. The Flow Designer displays a graphical representation of the application flow:
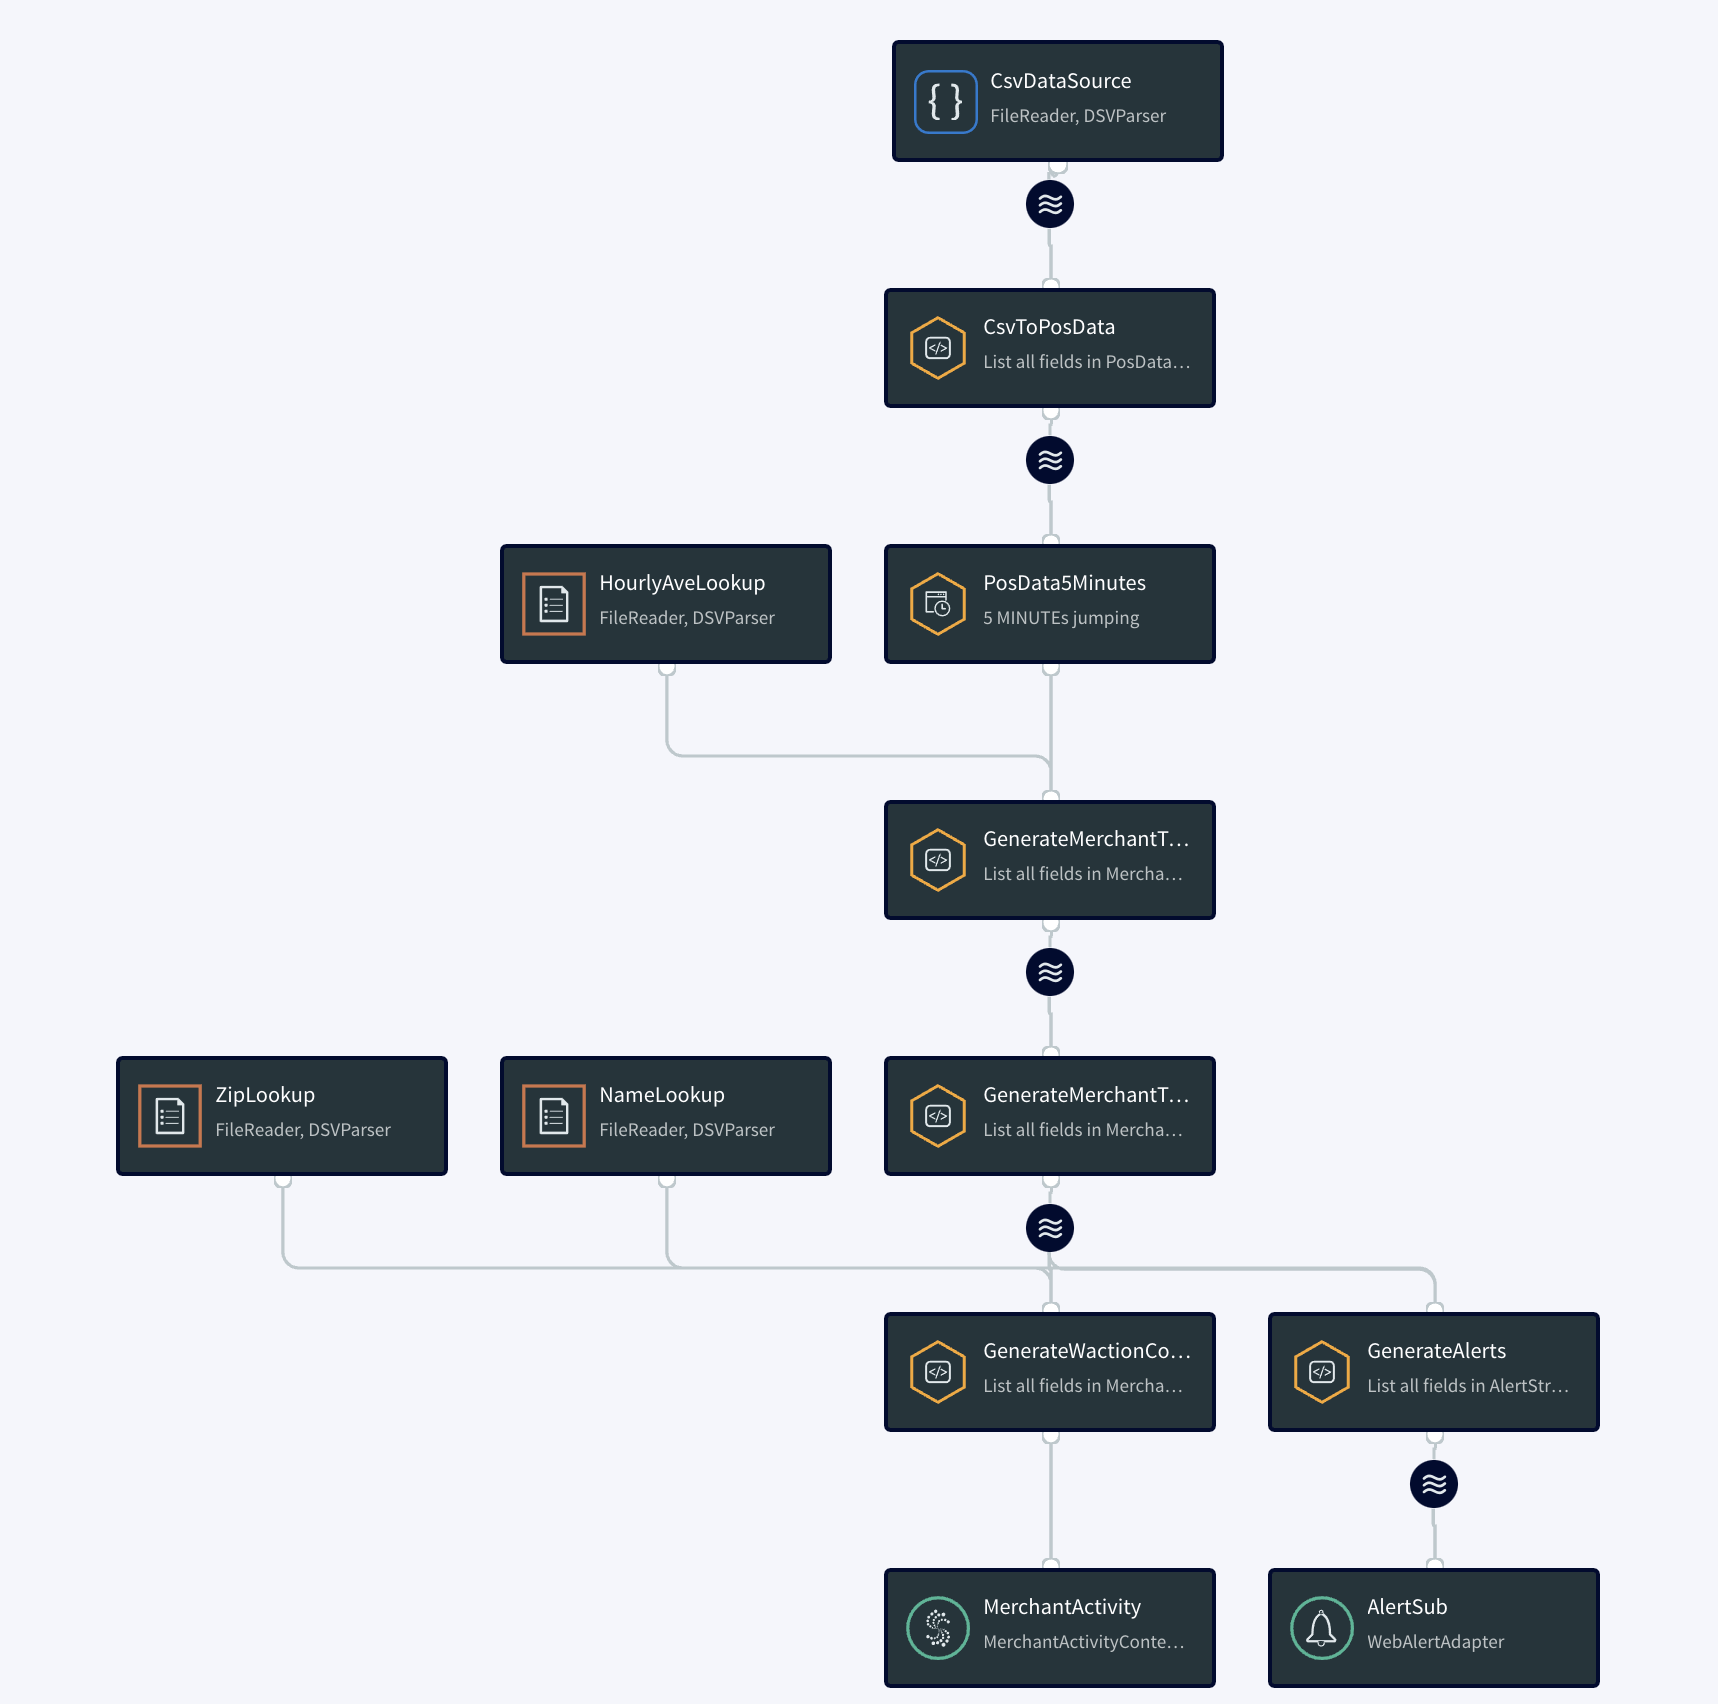
The following is simplified diagram of that flow:
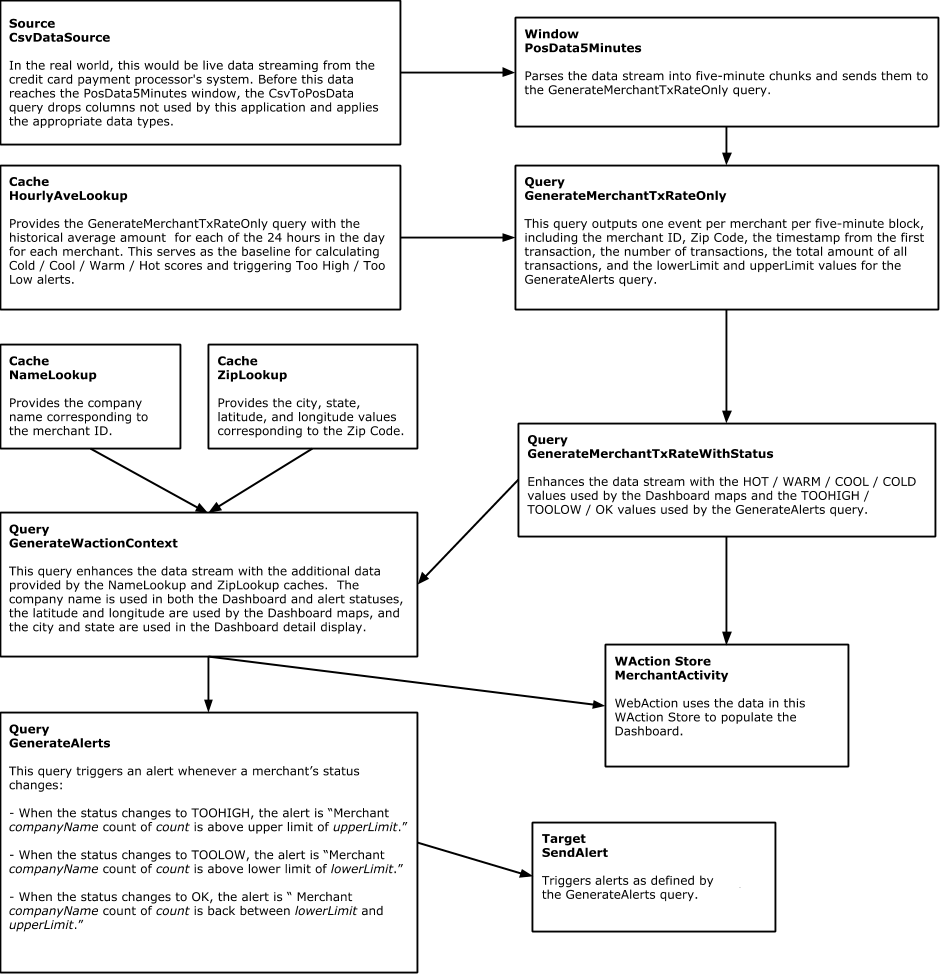
Step 1: Acquire Data
Striim has hundreds of connectors including change data capture from databases such as Oracle, SQLServer, MySQL, and PostgreSQL.
In this example, we’ll use a simple file source. We call this a ‘Source’ component in Striim.
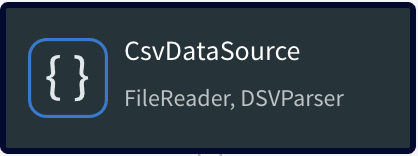
Double-clicking CsvDataSource opens it for editing:
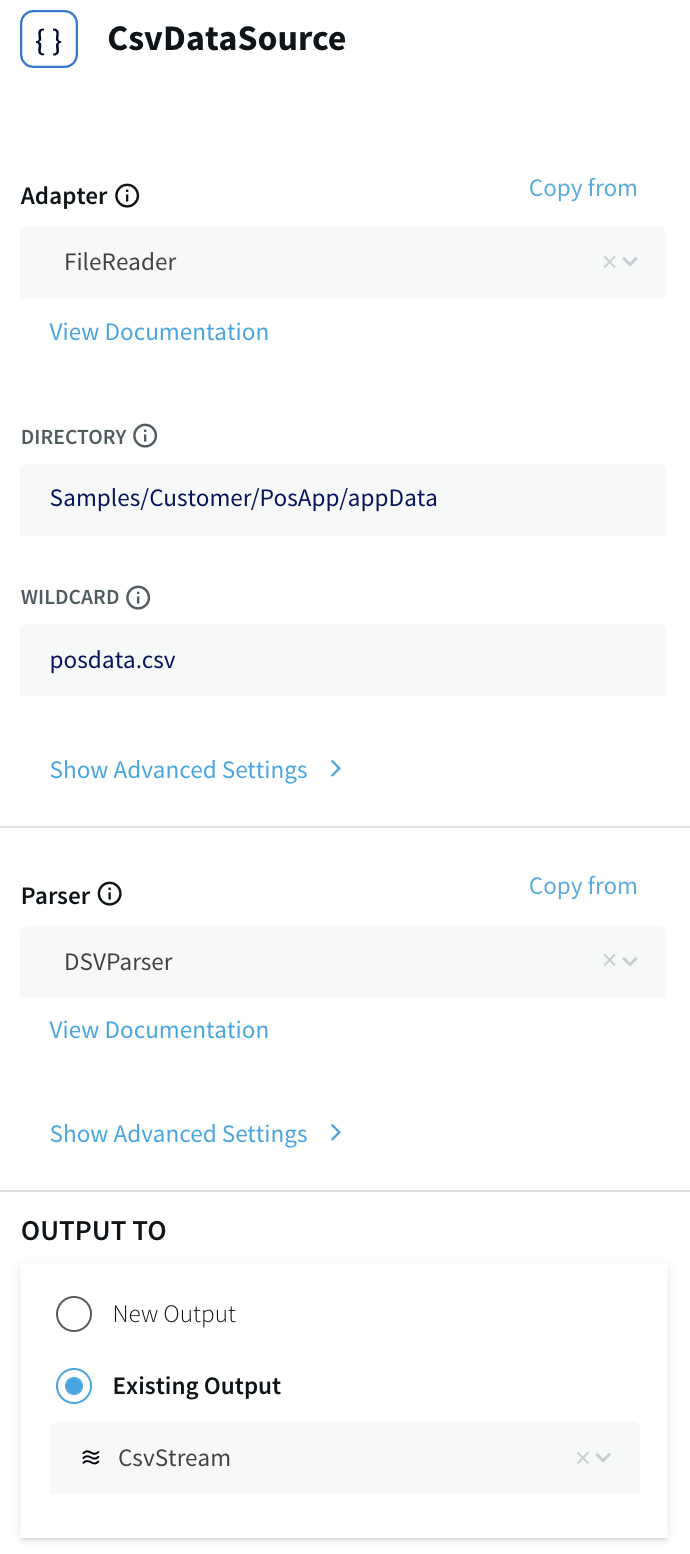
This is the primary data source for this application. In a real-world application, it would be real-time data. Here, the data comes from a comma-delimited file, posdata.csv. Here are the first two lines of that file:
BUSINESS NAME,MERCHANT ID,PRIMARY ACCOUNT NUMBER,POS DATA CODE,DATETIME,EXP DATE,CURRENCY CODE,AUTH AMOUNT,TERMINAL ID,ZIP,CITY,COMPANY


1,D6RJPwyuLXoLqQRQcOcouJ26KGxJSf6hgbu,6705362103919221351,0,20130312173210,0916,USD,2.20,5150279519809946,41363,Quicksand
In Striim terms, each line of the file is an event, which in many ways is comparable to a row in a SQL database table, and and can be used in similar ways. Click Show Advanced Settings to see the DSVParser properties:
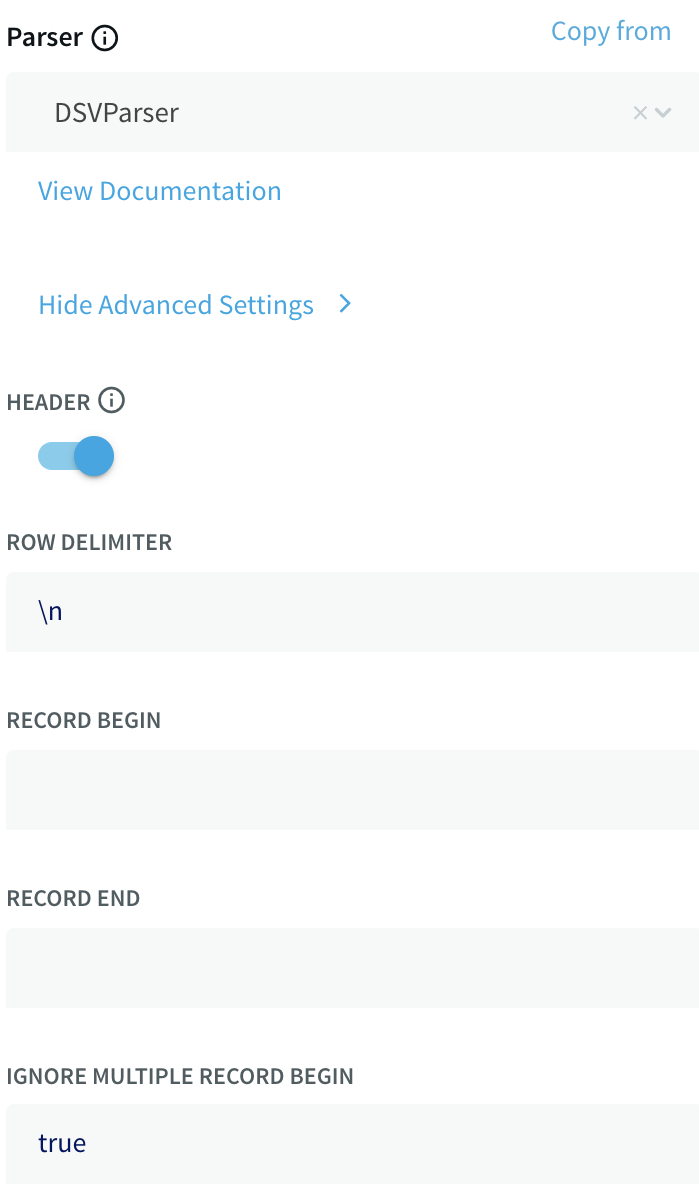
The True setting for the header property indicates that the first line contains field labels that are not to be treated as data.
The “Output to” stream CsvStream automatically inherits the WAEvent type associated with the CSVReader:
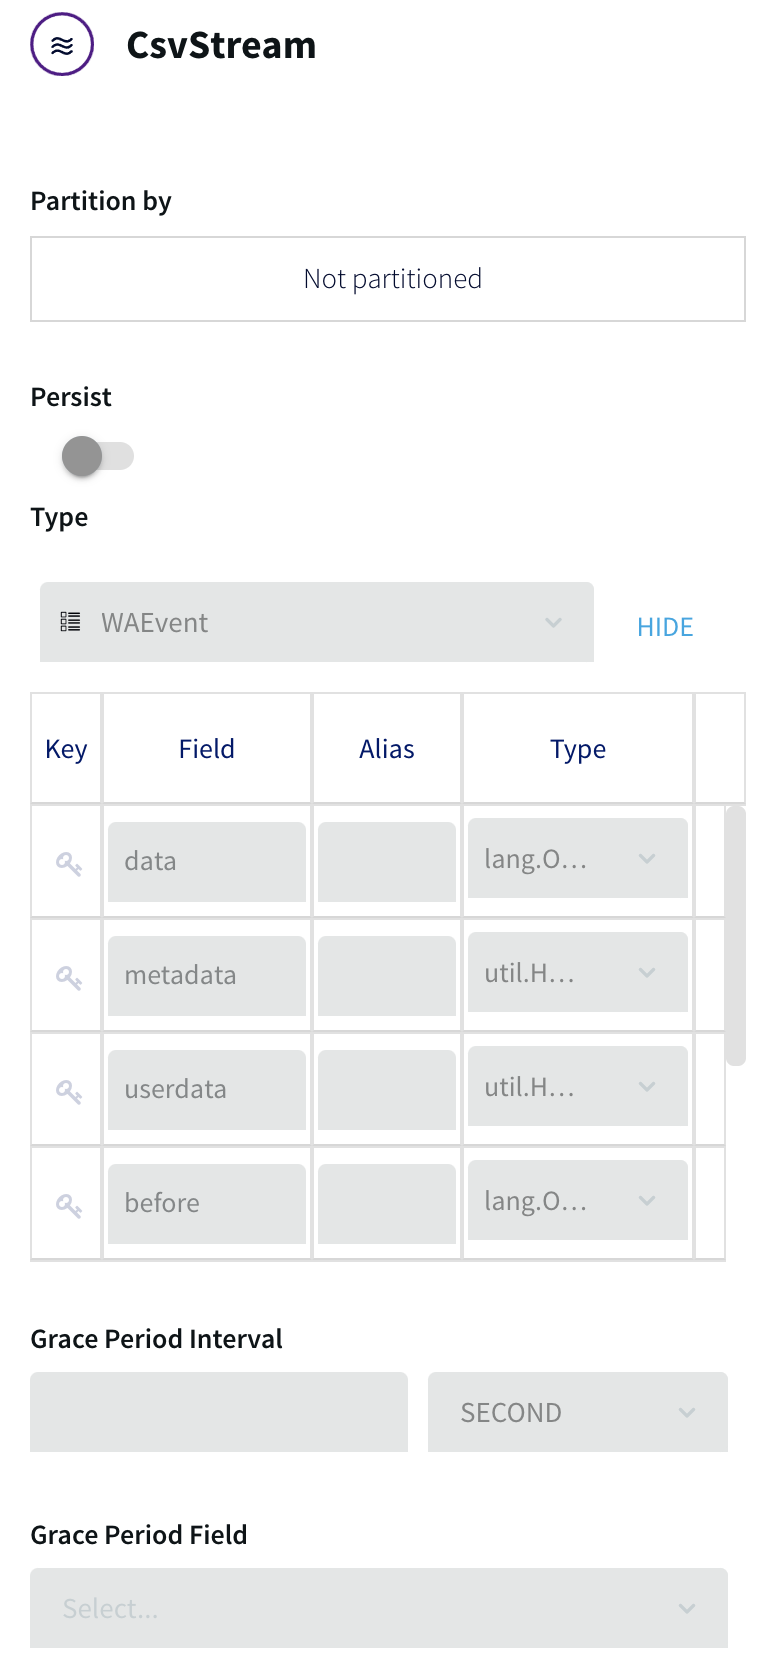
The only field used by this application is “data”, an array containing the delimited fields.
Step 2: Filter The Data Stream
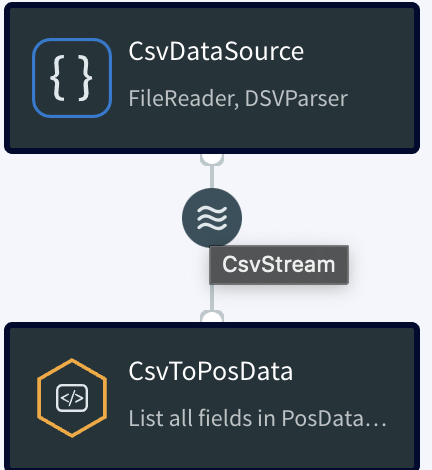
CsvDataSource outputs the data to CsvStream, which is the input for the query CsvToPosData:
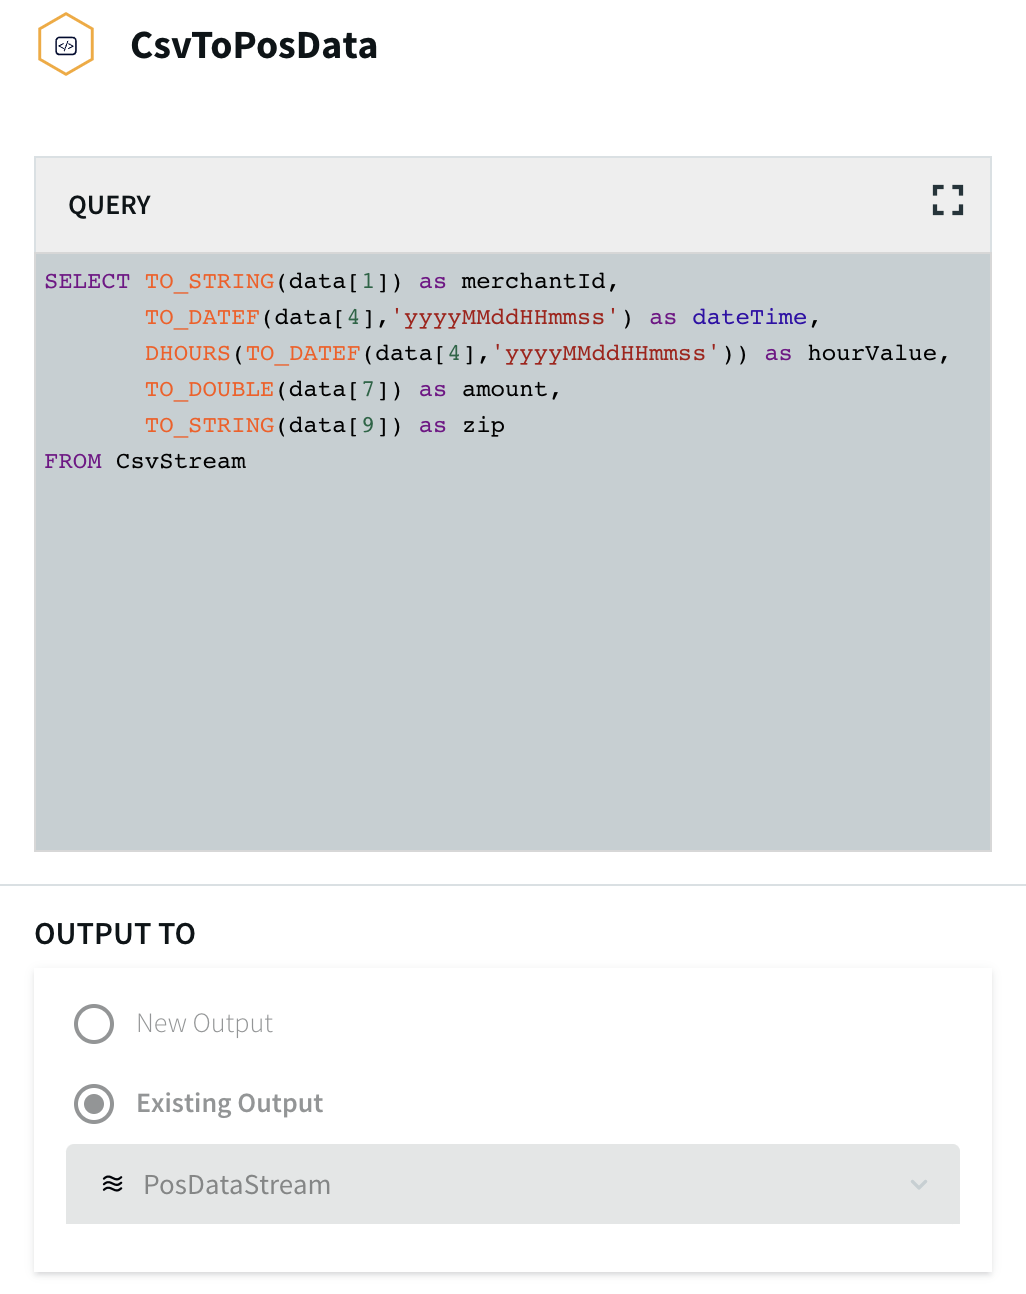
This CQ converts the comma-delimited fields from the source into typed fields in a stream that can be consumed by other Striim components. Here, “data” refers to the array mentioned above, and the number in brackets specifies a field from the array, counting from zero. Thus data[1] is MERCHANT ID,
data[4] is DATETIME, data[7] is AUTH AMOUNT, and data[9] is ZIP.
TO_STRING, TO_DATEF, and TO_DOUBLE functions cast the fields as the types to be used in the Output to stream. The DATETIME field from the source is converted to both a dateTime value, used as the event
timestamp by the application, and (via the DHOURS function) an integer hourValue, which is used to look up historical hourly averages from the HourlyAveLookup cache, discussed below.
The other six fields are discarded. Thus the first line of data from posdata.csv has at this point been code-reduced to five values:
D6RJPwyuLXoLqQRQcOcouJ26KGxJSf6hgbu (merchantId)
20130312173210 (DateTime)
17 (hourValue)
2.20 (amount)
41363 (zip)
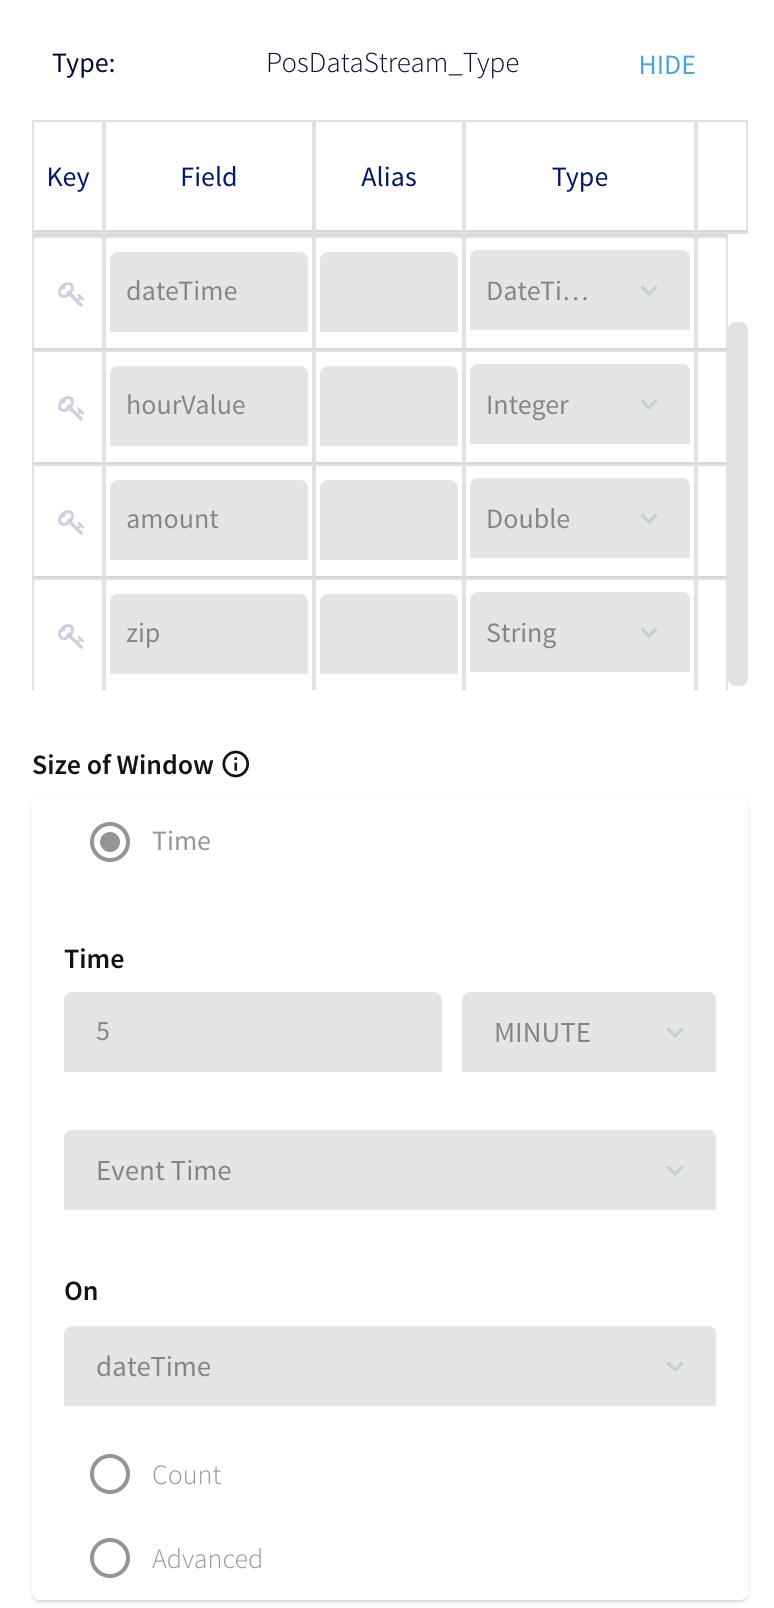
The CsvToPosDemo query outputs the processed data to PosDataStream:
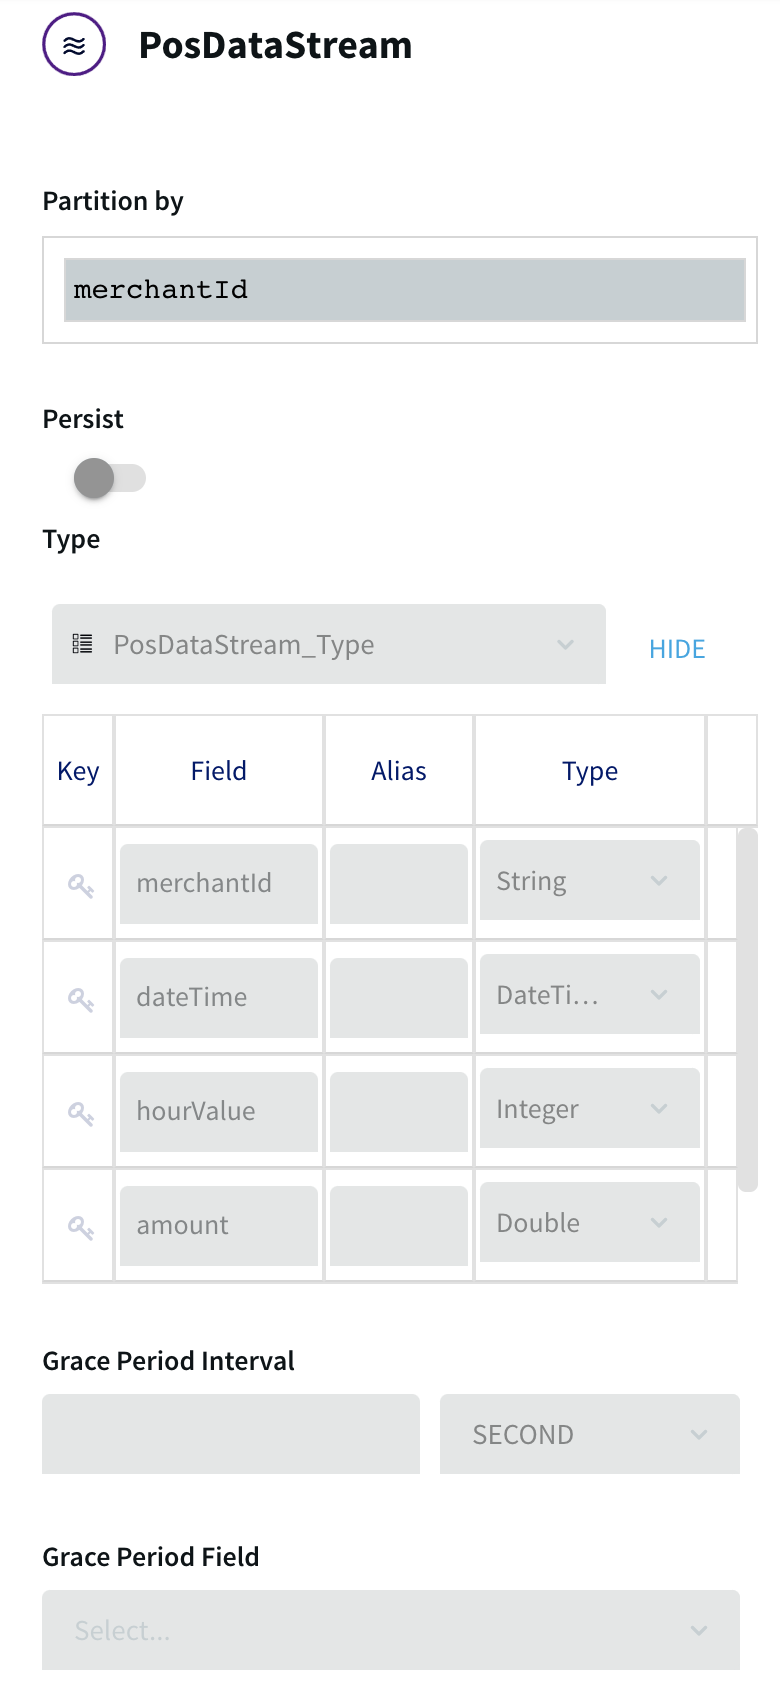
PosDataStream assigns the five remaining fields the names and data types in the order listed above:
PRIMARY ACCOUNT NUMBER to merchantID
DATETIME to dateTime
the DATETIME substring to hourValue
AUTH AMOUNT to amount
ZIP to zip
Step 3: Define the Data Set
PosDataStream passes the data to the window PosData5Minutes:
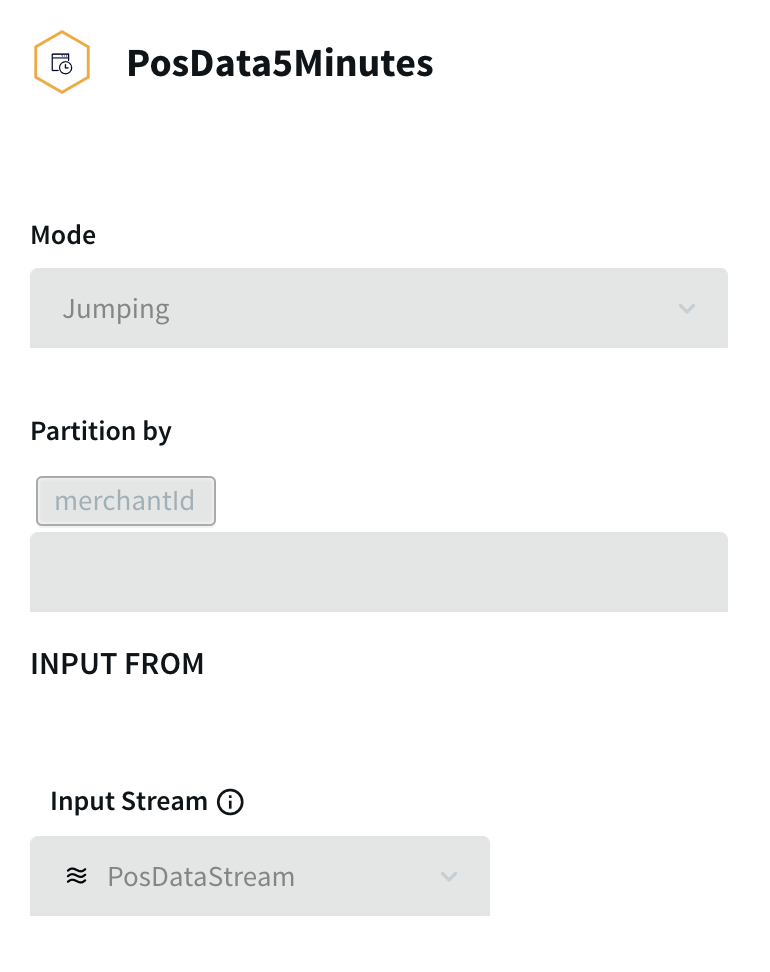
A window is in many ways comparable to a table in a SQL database, just as the events it contains are comparable to rows in a table. The Mode and Size settings determine how many events the window will contain and how it will be refreshed. With the Mode set to Jumping, this window is refreshed with a
completely new set of events every five minutes. For example, if the first five-minute set of events received when the application runs from 1:00 pm through 1:05 pm, then the next set of events will run from 1:06 through 1:10, and so on. (If the Mode were set to Sliding, the window continuously add new
events and drop old ones so at to always contain the events of the most recent five minutes.)
Step 4: Process and Enhance the Data
The PosData5Minutes window sends each five-minute set of data to the GenerateMerchantTxRateOnly query. As you can see from the following schema diagram, this query is fairly complex:
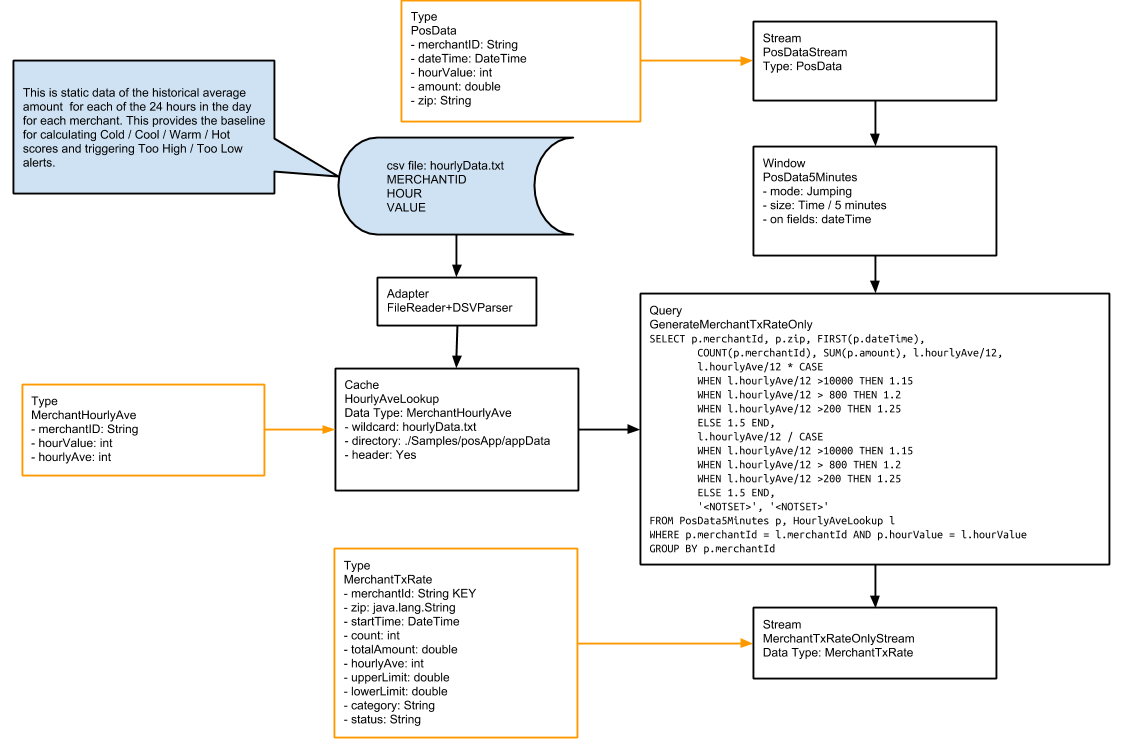
The GenerateMerchantTxRateOnly query combines data from the PosData5Minutes event stream with data from the HourlyAveLookup cache. A cache is similar to a source, except that the data is static rather than real-time. In the real world, this data would come from a periodically updated table in the
payment processor’s system containing historical averages of the number of transactions processed for each merchant for each hour of each day of the week (168 values per merchant). In this sample application, the source is a file, hourlyData.txt, which to simplify the sample data set has only 24 values
per merchant, one for each hour in the day.
For each five-minute set of events received from the PosData5Minutes window, the GenerateMerchantTxRateOnly query ouputs one event for each merchantID found in the set to MerchantTxRateOnlyStream, which applies the MerchantTxRate type. The easiest way to summarize what is happening in the above diagram
is to describe where each of the fields in the MerchantTxRateOnlySteam comes from:
| field | description | TQL |
|---|---|---|
| merchantId | the merchantID field from PosData5Minutes | SELECT p.merchantID |
| zip | the zip field from PosData5Minutes | SELECT … p.zip |
| startTime | the dateTime field for the first event for the merchantID in the five-minute set from PosData5Minutes | SELECT … FIRST(p.dateTime) |
| count | count of events for the merchantID in the five-minute set from PosData5Minutes | SELECT … COUNT(p.merchantID) |
| totalAmount | sum of amount field values for the merchantID in the five-minute set from PosData5Minutes | SELECT … SUM(p.amount) |
| hourlyAve | the hourlyAve value for the current hour from HourlyAveLookup, divided by 12 to give the five-minute average | SELECT … l.hourlyAve/12 …
WHERE … p.hourValue = l.hourValue
|
| upperLimit | the hourlyAve value for the current hour from HourlyAveLookup, divided by 12, then multiplied by 1.15 if the value is 200 or less, 1.2 if the value is between 201 and 800, 1.25 if the value is between 801 and 10,000, or 1.5 if the value is over 10,000 | SELECT …l.hourlyAve/12 * CASE
WHEN l.hourlyAve/12 >10000 THEN 1.15
WHEN l.hourlyAve/12 > 800 THEN 1.2
WHEN l.hourlyAve/12 > 200 THEN 1.25
ELSE 1.5 END
|
| lowerLimit | the hourlyAve value for the current hour from HourlyAveLookup, divided by 12, then divided by 1.15 if the value is 200 or less, 1.2 if the value is between 201 and 800, 1.25 if the value is between 801 and 10,000, or 1.5 if the value is over 10,000 | SELECT …l.hourlyAve/12 / CASE
WHEN l.hourlyAve/12 >10000 THEN 1.15
WHEN l.hourlyAve/12 > 800 THEN 1.2
WHEN l.hourlyAve/12 > 200 THEN 1.25
ELSE 1.5 END
|
| category, status | placeholders for values to be added | SELECT … '<NOTSET>' |
The MerchantTxRateOnlyStream passes this output to the GenerateMerchantTxRateWithStatus query, which populates the category and status fields by evaluating the count, upperLimit, and lowerLimit fields:
SELECT merchantId,
  zip,
  startTime,
  count,
  totalAmount,
  hourlyAve,
  upperLimit,
  lowerLimit,
    CASE
      WHEN count > 10000 THEN 'HOT'
      WHEN count > 800 THEN 'WARM'
      WHEN count > 200 THEN 'COOL'
      ELSE 'COLD' END,
    CASE
      WHEN count > upperLimit THEN 'TOOHIGH'
      WHEN count < lowerLimit THEN 'TOOLOW'
      ELSE 'OK' END
FROM MerchantTxRateOnlyStream
The category values are used by the Dashboard to color-code the map points. The status values are used by the GenerateAlerts query.

The output from the GenerateMerchantTxRateWithStatus query goes to MerchantTxRateWithStatusStream.
Step 5: Populate the Dashbhoard
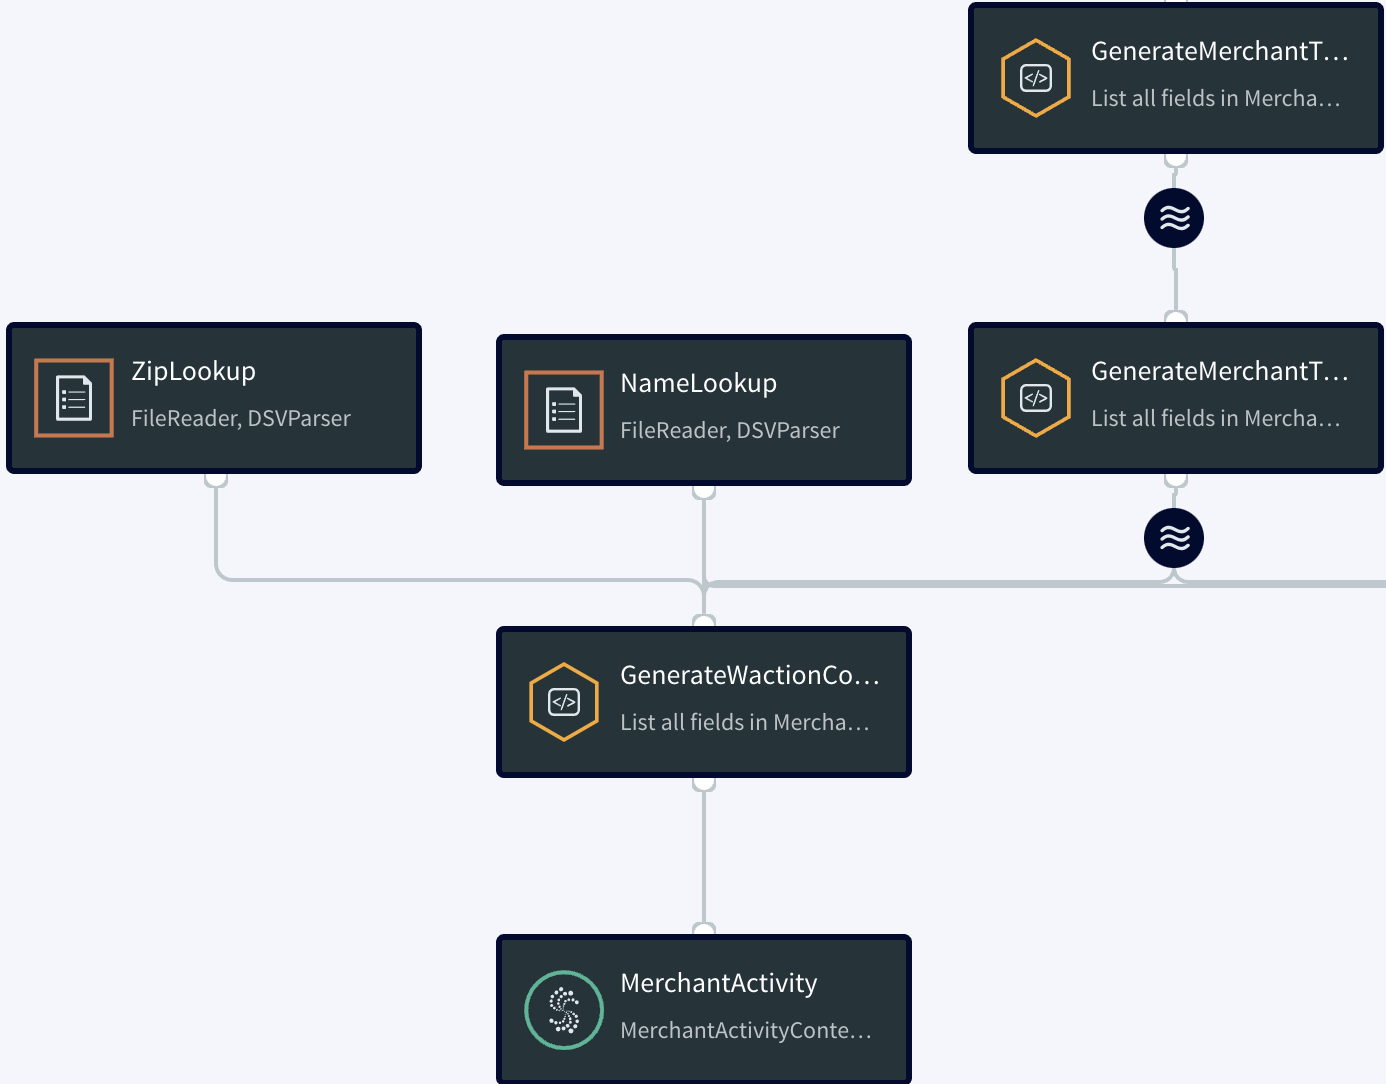
The GenerateWactionContent query enhances the data from MerchantTxRateWithStatusStream with the merchant’s company, city, state, and zip code, and the latitude and longitude to position the merchant on the map, then populates the MerchantActivity WActionstore:
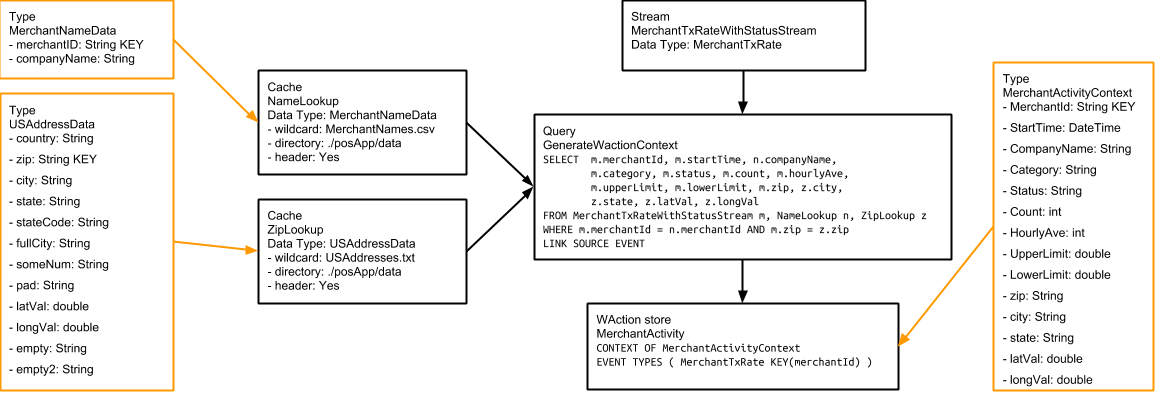
In a real-world application, the data for the NameLookup cache would come from a periodically updated table in the payment processor’s system, but the data for the ZipLookup cache might come from a file such as the one used in this sample application.
When the application finishes processing all the test data, the WActionStore will contain 423 WActions, one for each merchant. Each WAction includes the merchant’s context information (MerchantId, StartTime, CompanyName, Category, Status, Count, HourlyAve, UpperLimit, LowerLimit, Zip, City, State,
LatVal, and LongVal) and all events for that merchant from the MerchantTxRateWithStatusStream (merchantId, zip, String, startTime, count, totalAmount, hourlyAvet, upperLimit, lowerLimit, category, and status for each of 40 five-minute blocks). This data is used to populate the dashboard, as detailed in
PosAppDash.
Step 6: Trigger Alerts

MerchantTxRateWithStatusStream sends the detailed event data to the GenerateAlerts query, which triggers alerts based on the Status value:
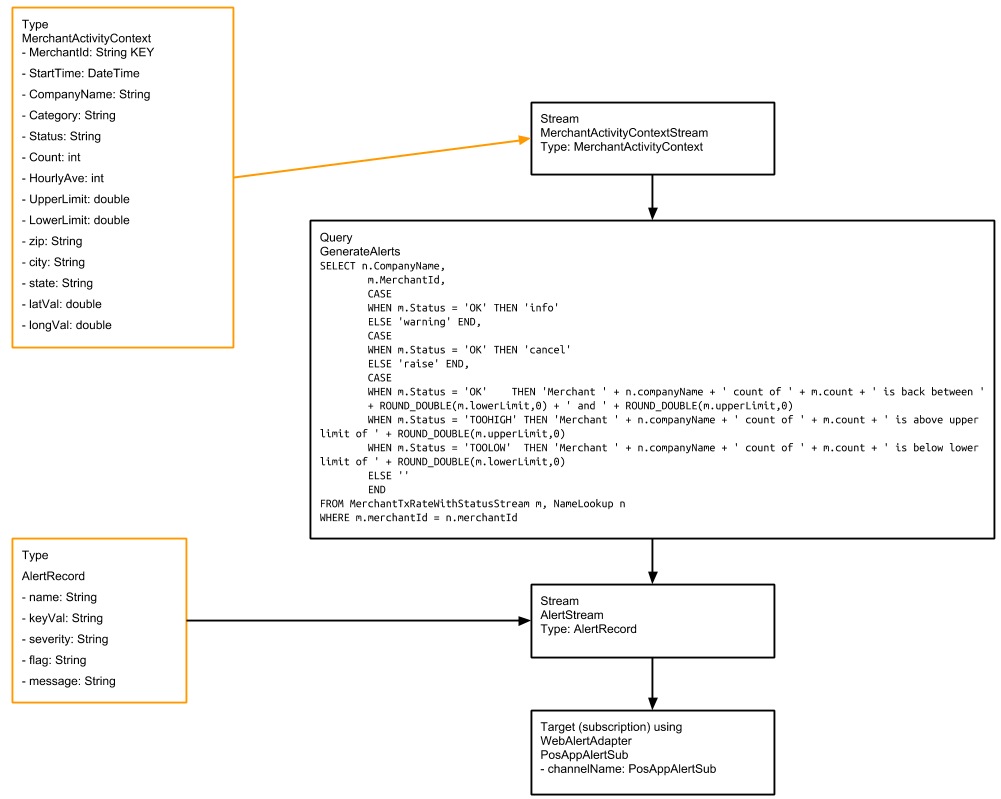
When a merchant’s status changes to TOOLOW or TOOHIGH, Striim will send an alert such as, “WARNING – alert from Striim – POSUnusualActivity – 2013-12-20 13:55:14 – Merchant Urban Outfitters Inc. count of 12012 is below lower limit of 13304.347826086958.” The “raise” value for the flag field instructs the subscription not to send another alert until the status returns to OK.
When the status returns to OK, Striim will send an alert such as, “INFO – alert from Striim – POSUnusualActivity – 2013-12-20 14:02:27 – Merchant Urban Outfitters Inc. count of 15853 is back between 13304.347826086958 and 17595.0.” The “cancel” value for the flag field instructs the subscription to send an alert the next time the status changes to TOOLOW or TOOHIGH. See Sending alerts from applications for more information on info, warning, raise, and cancel.
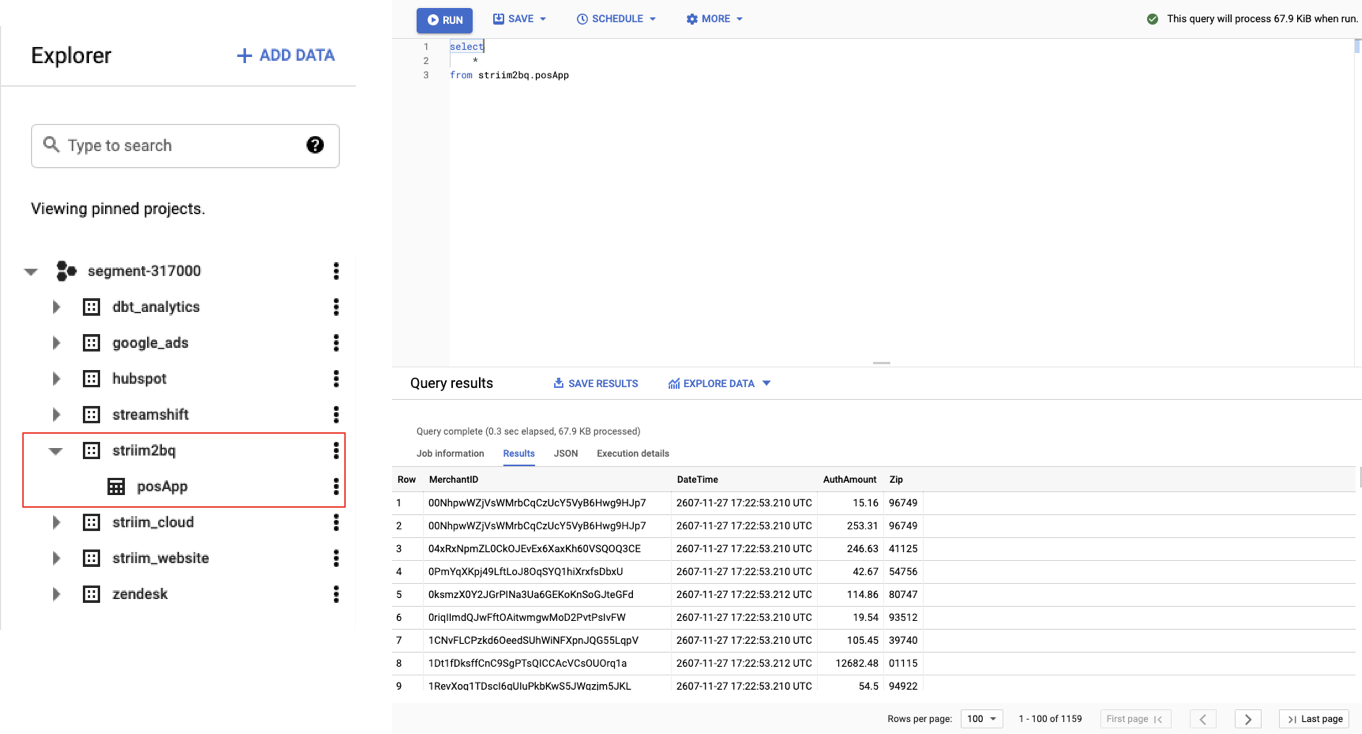
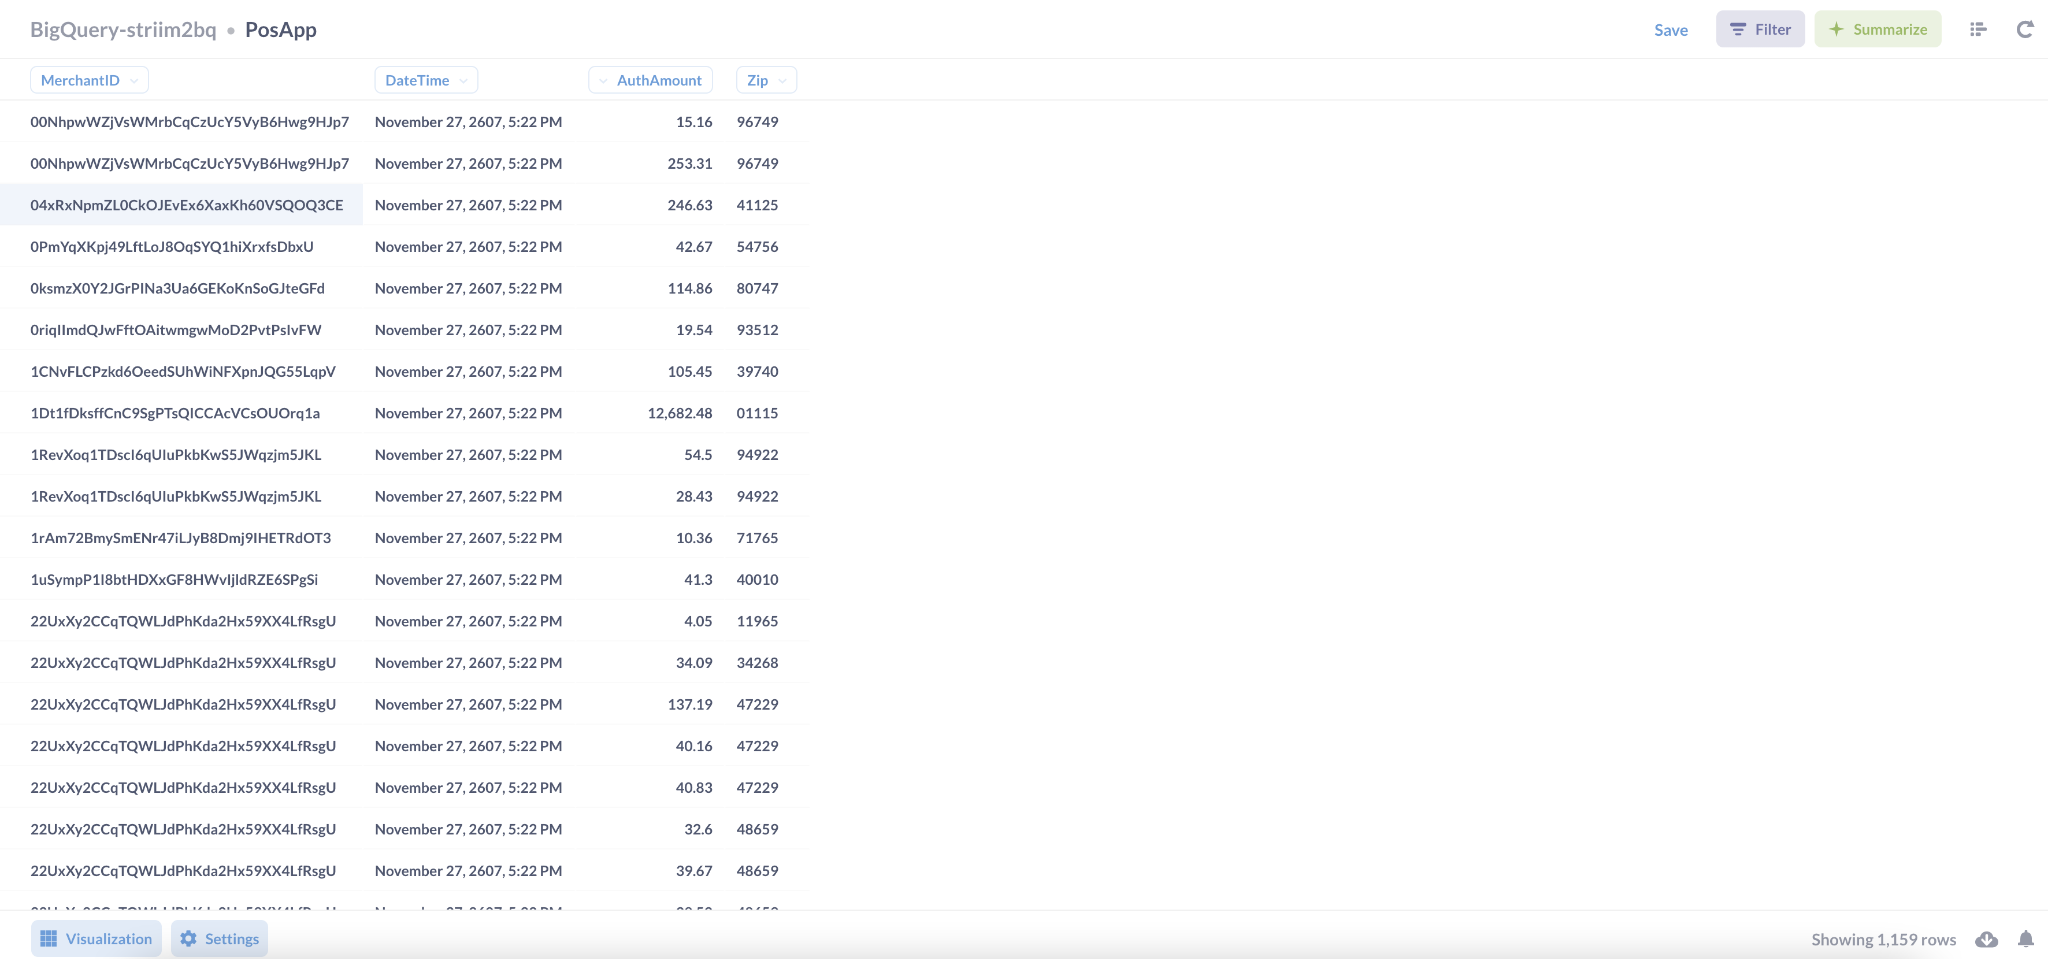
Step 7: Stream data to BigQuery
Now you can stream the enriched point-of-sale analytical data to cloud data platforms such as BigQuery, Snowflake, and Redshift. In this example, we’re going to stream the data to BigQuery for storage and analysis.
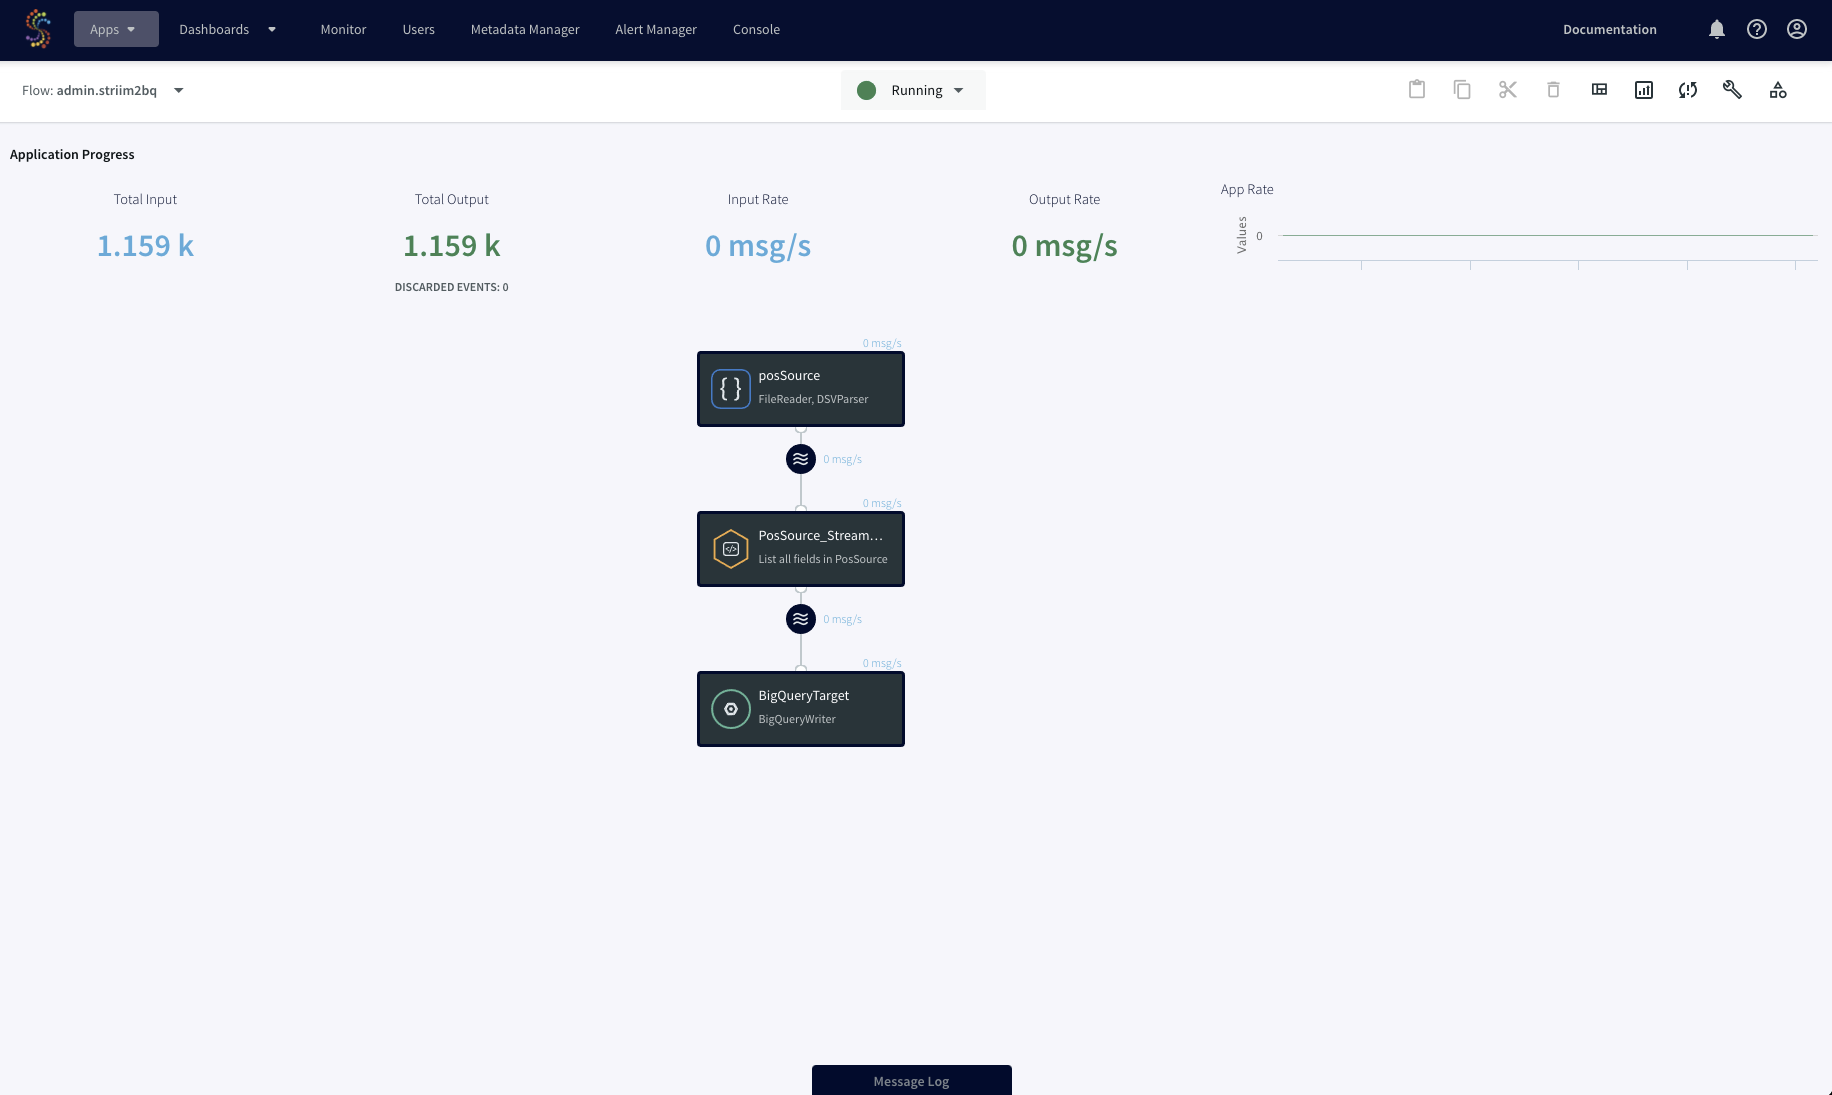
Striim can stream data into BigQuery in real-time while optimizing costs with partition pruning on merge operations. After the data is loaded into BigQuery, your team can analyze it with your business intelligence tool of choice. In this example we’re generating the reports in Metabase.
Get Started
Try this recipe yourself for free by signing up for a trial or talking to sales team for hands-on guidance. Striim can be deployed on your laptop, in a docker container, or directly on your cloud-service provider of
choice.

Striim
Striim’s unified data integration and streaming platform connects clouds, data and applications.

Google BigQuery
BigQuery is a serverless, highly scalable multicloud data warehouse.

BI Tool (Metabase)
Metabase is an open source business intelligence tool.
