Monitoring end-to-end lag (LEE)
End-to-end lag ("LEE") is the time it takes from the origin of an event in an external source to its final delivery by Striim to an external target. This data is sampled every five seconds and retained for 24 hours. If within a five-second sample period no event is delivered to the target, no LEE is recorded for that period.
A low and stable LEE is desirable. A high but stable LEE indicates either that Striim is reading stale data from the source or a window or some other component in the Striim application is holding data for a significant time. A continuously increasing LEE indicates that events are being received from the source faster than the target can handle them, which might indicate that you should consider Creating multiple writer instances (parallel threads) or reducing network bottlenecks between Striim and the external target.
Note: For accurate LEE calculation with SQL Server sources, the Fetch Transaction Metadata property must be set to True (see MS SQL Reader properties).
Viewing LEE
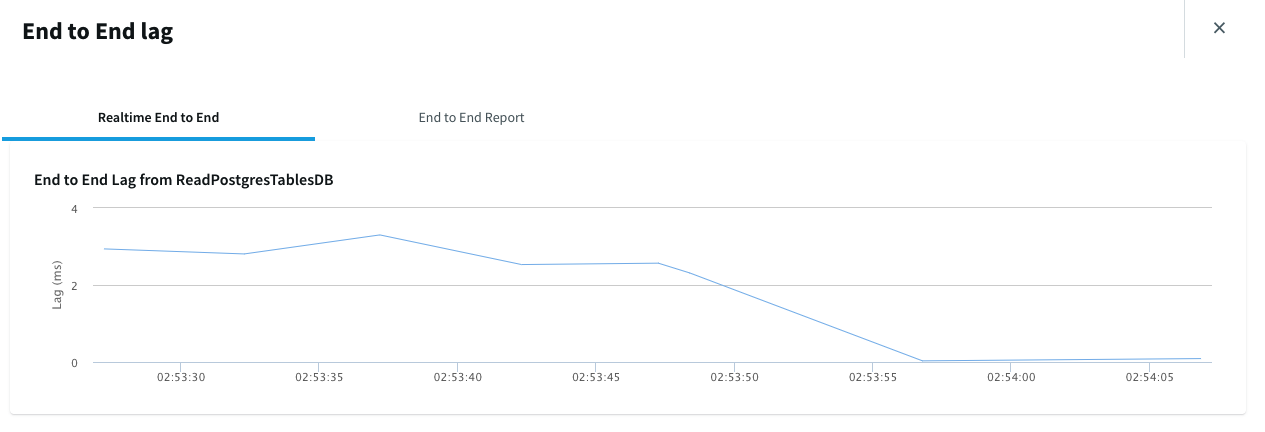
In the Web UI: Go to the Flow Designer page for the application and click View End to End Lag (at the top right corner) to display a line chart of LEE in milliseconds over time. If the target has multiple sources, you will see a chart for each.
In the console:
REPORT LEE+;will return the LEE for each source-target combination in the cluster, the time each was measured, the start time type (see discussion of "Start time types" below), and the statistics for the most recent sample (see discussion below).╒═════════════════════════════════════════════════════════════════════════════════════════════════════════════════════════════╕ │ Lag End-to-End (LEE) Report │ ├────────────────────────┬────────────────────────┬────────────────────────┬────────────────────────┬─────────────────────────┤ │ Source │ Target │ Latest LEE (seconds) │ Measured At │ Source Time │ ├────────────────────────┼────────────────────────┼────────────────────────┼────────────────────────┼─────────────────────────┤ │ SamplesDB.ReadPostgres │ SamplesDB.WriteToPostg │ 0.067 │ 2021-07-29 15:03:52.14 │ Idle │ │ TablesDB (DatabaseRead │ resTable (DatabaseWrit │ │ 3 PDT │ │ │ er) │ er) │ │ │ │ ╞════════════════════════╧════════════════════════╧════════════════════════╧════════════════════════╧═════════════════════════╡ │ Lag End-to-End (LEE) Recent Statistics │ ├───────────────────────┬───────────────────────┬────────────────┬────────────────┬────────────────┬──────────────────────────┤ │ Source │ Target │ Minimum LEE (s │ Maximum LEE (s │ Average LEE (s │ Sample Size │ ├───────────────────────┼───────────────────────┼────────────────┼────────────────┼────────────────┼──────────────────────────┤ │ SamplesDB.ReadPostgre │ SamplesDB.WriteToPost │ 0.067 │ 0.067 │ 0.067 │ 1 │ │ sTablesDB (DatabaseRe │ gresTable (DatabaseWr │ │ │ │ │ │ ader) │ iter) │ │ │ │ │ └───────────────────────┴───────────────────────┴────────────────┴────────────────┴────────────────┴──────────────────────────┘
The following commands return various subsets of that information (you may omit the namespace if the specified objects are in the current namespace). Use
LEE+to include statistics for the most recent five-second sample.REPORT LEE[+] <namespace.source name> <namespace.target name>;- LEE for the specified source-target combinationREPORT LEE STATS <namespace.source name> <namespace.target name> [-START '<start time>'] [-END '<end time>'] [-ROLLUPINTERVAL '<interval>'];- summary of LEE for the specified source and target over the specified time periodSpecify the
ROLLUPINTERVALas minutes or hours (for example,15mor1h. To specify a start or end time from the previous day, specify the time in the formatyyyy/MM/dd-HH:mmoryyyy/MM/dd-HH:mm:ss.For example,
REPORT LEE STATS OracleSource KafkaTarget -START '10:00' -END '12:00' -ROLLUPINTERVAL '1h';would return statistics for two one-hour intervals, 10-11 am and 11am-noon, for the current day.REPORT LEE[+] <namespace.source name> *;- LEEs for all targets of the specified sourceREPORT LEE[+] * <namespace.target name>;- LEEs for all sources of the specified targetREPORT LEE[+] APPLICATION <namespace.application name>;- LEEs for all targets in the specified application (sources may be in other applications)
Using the system health REST API (Monitoring using the system health REST API): Each target element of the health map includes the latest LEE for each source in the following format:
"lagEnd2End": {
   "data": [
      {
         "source": "ns1.source1",
         "target": "ns1.target1",
         "lee": 0.014,
         "at": 1589415119444,
         "type": "Observed"
      }
   ]
How LEE is calculated
Striim calculates end-to-end lag by subtracting an event's the start time from its end time. This figure includes:
the time it takes Striim to acquire the event data from the external source
within Striim, any time the event spends in buffers and queue;, being enriched, joined, aggregated, filtered, or otherwise processed; and any time required for communication between nodes in a cluster
the time it takes Striim to deliver the event to the target
LEE is calculated separately for each source-target combination.
If the clocks of the source server, Striim server, and target server are not synchronized, the lag will not be calculated correctly.
When there are multiple paths between a source and a target, events between the source and target are distributed among multiple Striim servers in a multi-node cluster, the most recent LEE will be displayed. In this situation, the LEE graph in the web UI may be jagged or noisy.
Start time types: Striim uses one of the following as the start time (these types appear in the MON and system health object reports):
Attribute: a timestamp from an attribute of the event (for instance, a JSON timestamp field)
Commit: a database commit timestamp
Idle: the time Striim inserted a mock event into the pipeline. Striim uses these to track LEE when no events are being received from the external source because it is inactive. Idle events are used only to measure LEE and are discarded as they arrive at the writer.
Ingestion: a Kafka broker ingestion timestamp
Observed: the time the event was received by the reader (used when no timestamp is available from the external source)
Operation: the timestamp of an individual operation in a database transaction
End time: Striim uses the time it receives an acknowledgement from the external target as the end time.
Configuring LEE
Two properties may be configured in startUp.properties / agent.conf:
LeeRate / striim.node.LeeRate: By default, LEE is computed for every source event. Set this to integer n to compute LEE every n events. For example, LeeRate=10 will calculate LEE every ten source events. Set to 0 to disable LEE.
The following writers sample LEE data every 100 events. To receive LEE results for these writers, leave LeeRate set to its default: with any other value, they may report no results.
ADLS Gen2 Writer
Azure Blob Writer
Azure Synapse Writer
BigQuery Writer
Database Writer
Databricks Writer
Fabric Data Warehouse Writer
Fabric Lakehouse File Writer
GCS Writer
HDFS Writer
Hive Writer
S3 Writer
Snowflake Writer
Spanner Writer
LeeTimeout / striim.node.LeeTimeout: The length of time an external source can be inactive before Striim inserts Idle events (see discussion of "Start time types" above.) The default is 10 seconds. Set to 0 to disable insertion of idle events.
These properties are set independently for each server and agent.